How to Find and Choose the Best Images for Your Project
To spot high-quality images, you’ll need to draw on your basic visual literacy skills.

As we’ve been learning in this visual literacy column , images tell stories. From photographs to illustrations to maps, they offer glimpses into moments beyond our reach and help us better understand our world. Delving into a variety of visual materials, we’ve learned to recognize the elements that make up an image—such as composition , color , and symbolism —and understand how each contributes to an image’s overall interpretation or significance. Developing visual literacy skills such as these enhances our understanding and appreciation of all images—those we seek out intentionally and those we encounter by chance: a billboard passed during a commute, an image in a newspaper article, a photo shared on social media. It also helps us sort through and evaluate the quality of the images we see and make choices about which images are relevant for our specific purpose.

To take the next step in our journey towards visual literacy, we need to know where to find high-quality images that meet our research needs and what questions to ask about the images we decide to use.

Why Do You Need the Image?
When beginning to look for images or other visual material, it’s important to first understand the nature of your need, to ask yourself why you’re seeking out images in the first place. You might be using them to learn more about a current topic or to research different perspectives on a topic. Alternatively, you might simply be looking for something visually appealing or interesting to inspire you. Depending on your end goal, the types of images and places you’ll look are different.
What is the Topic You are Exploring?
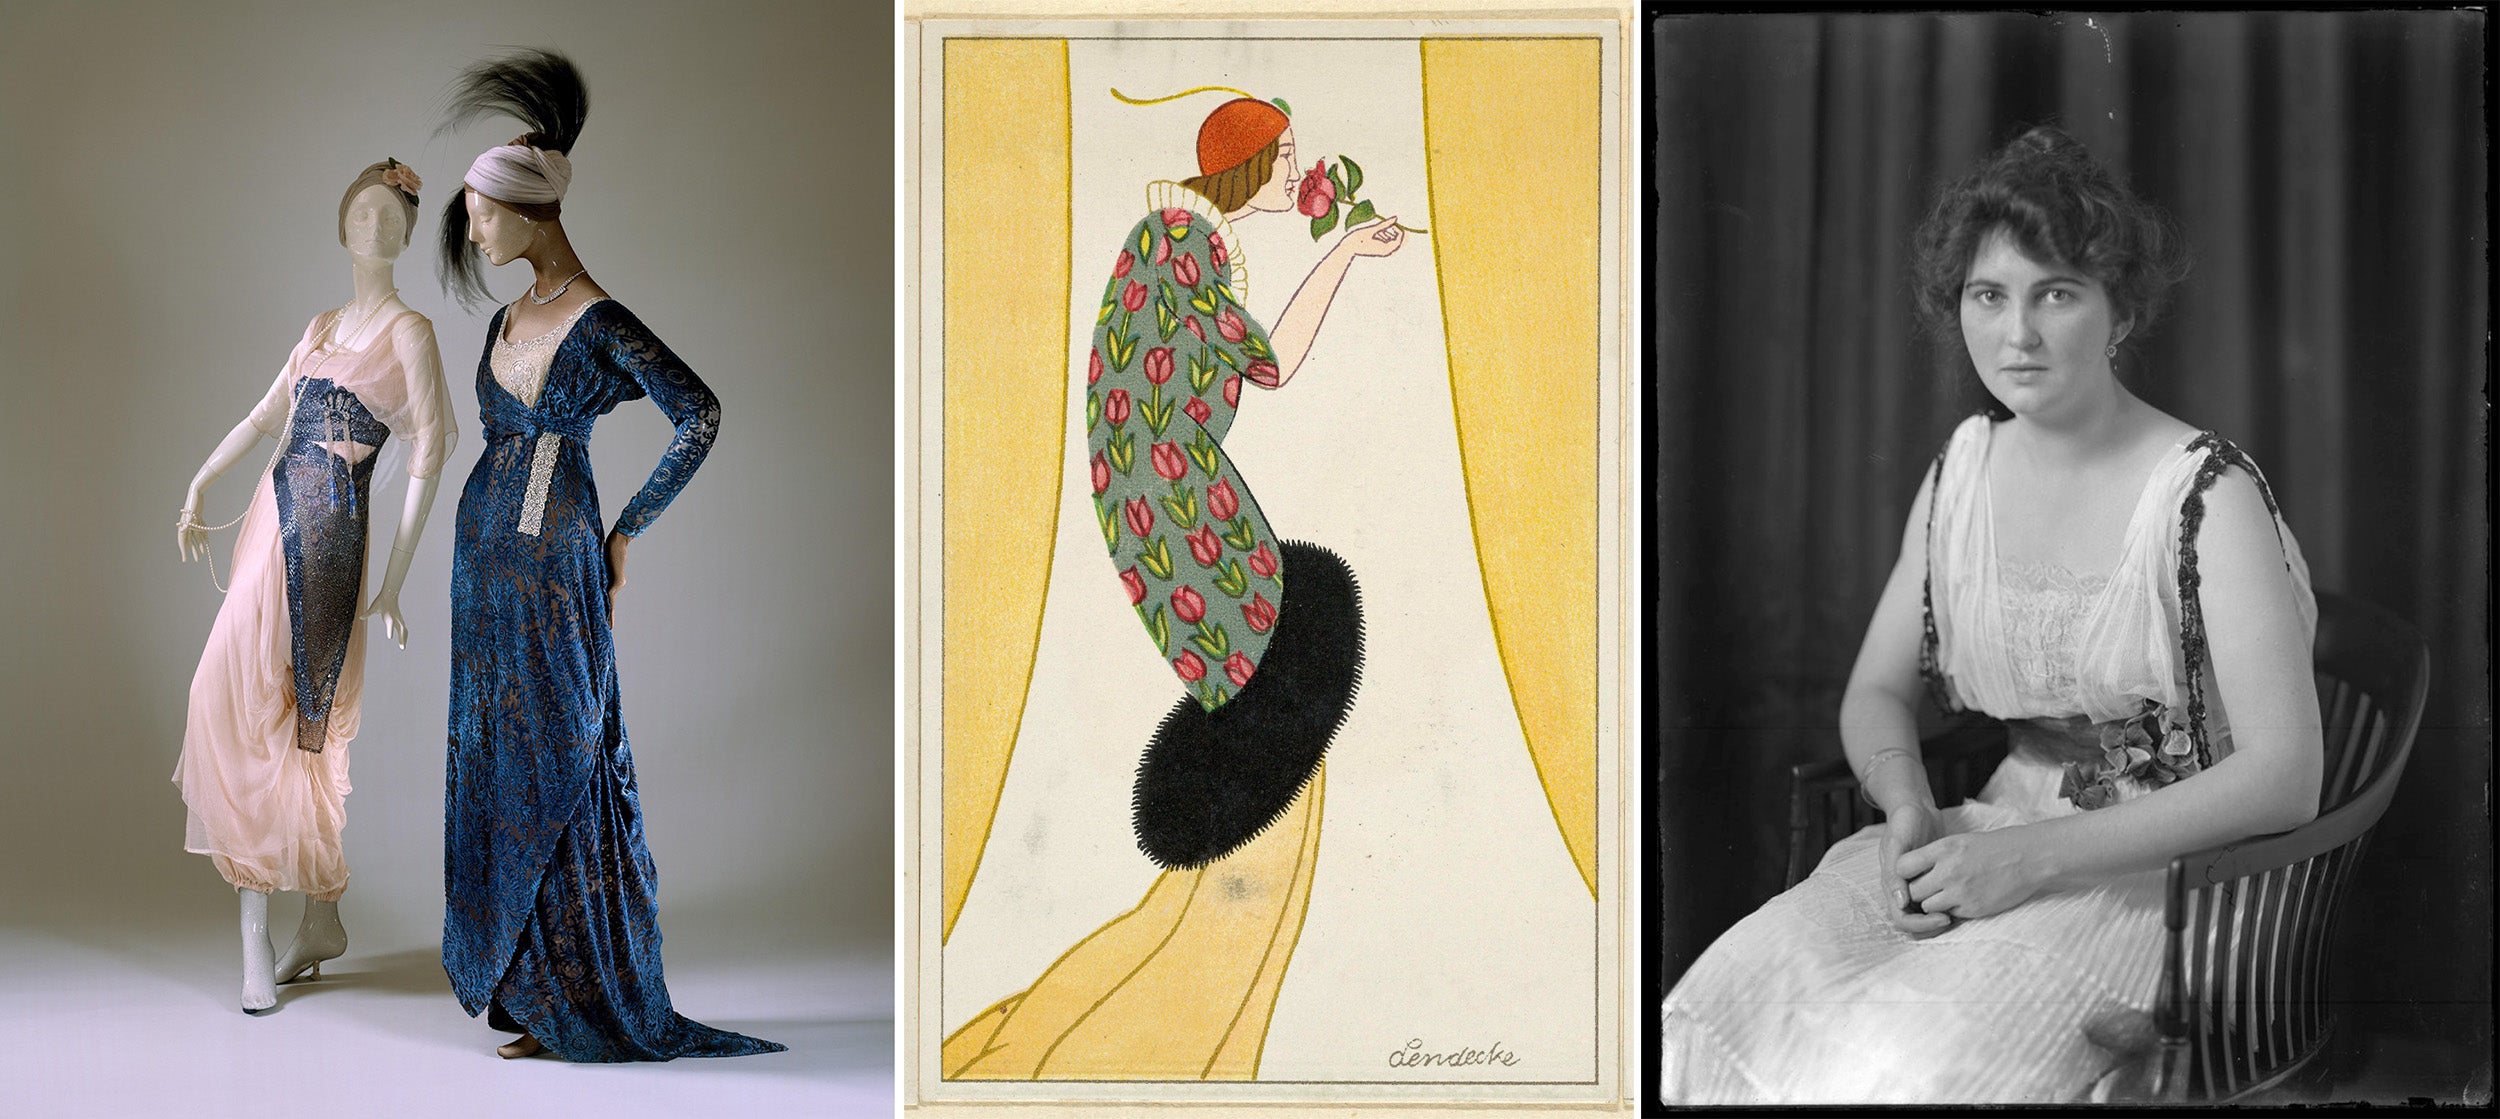
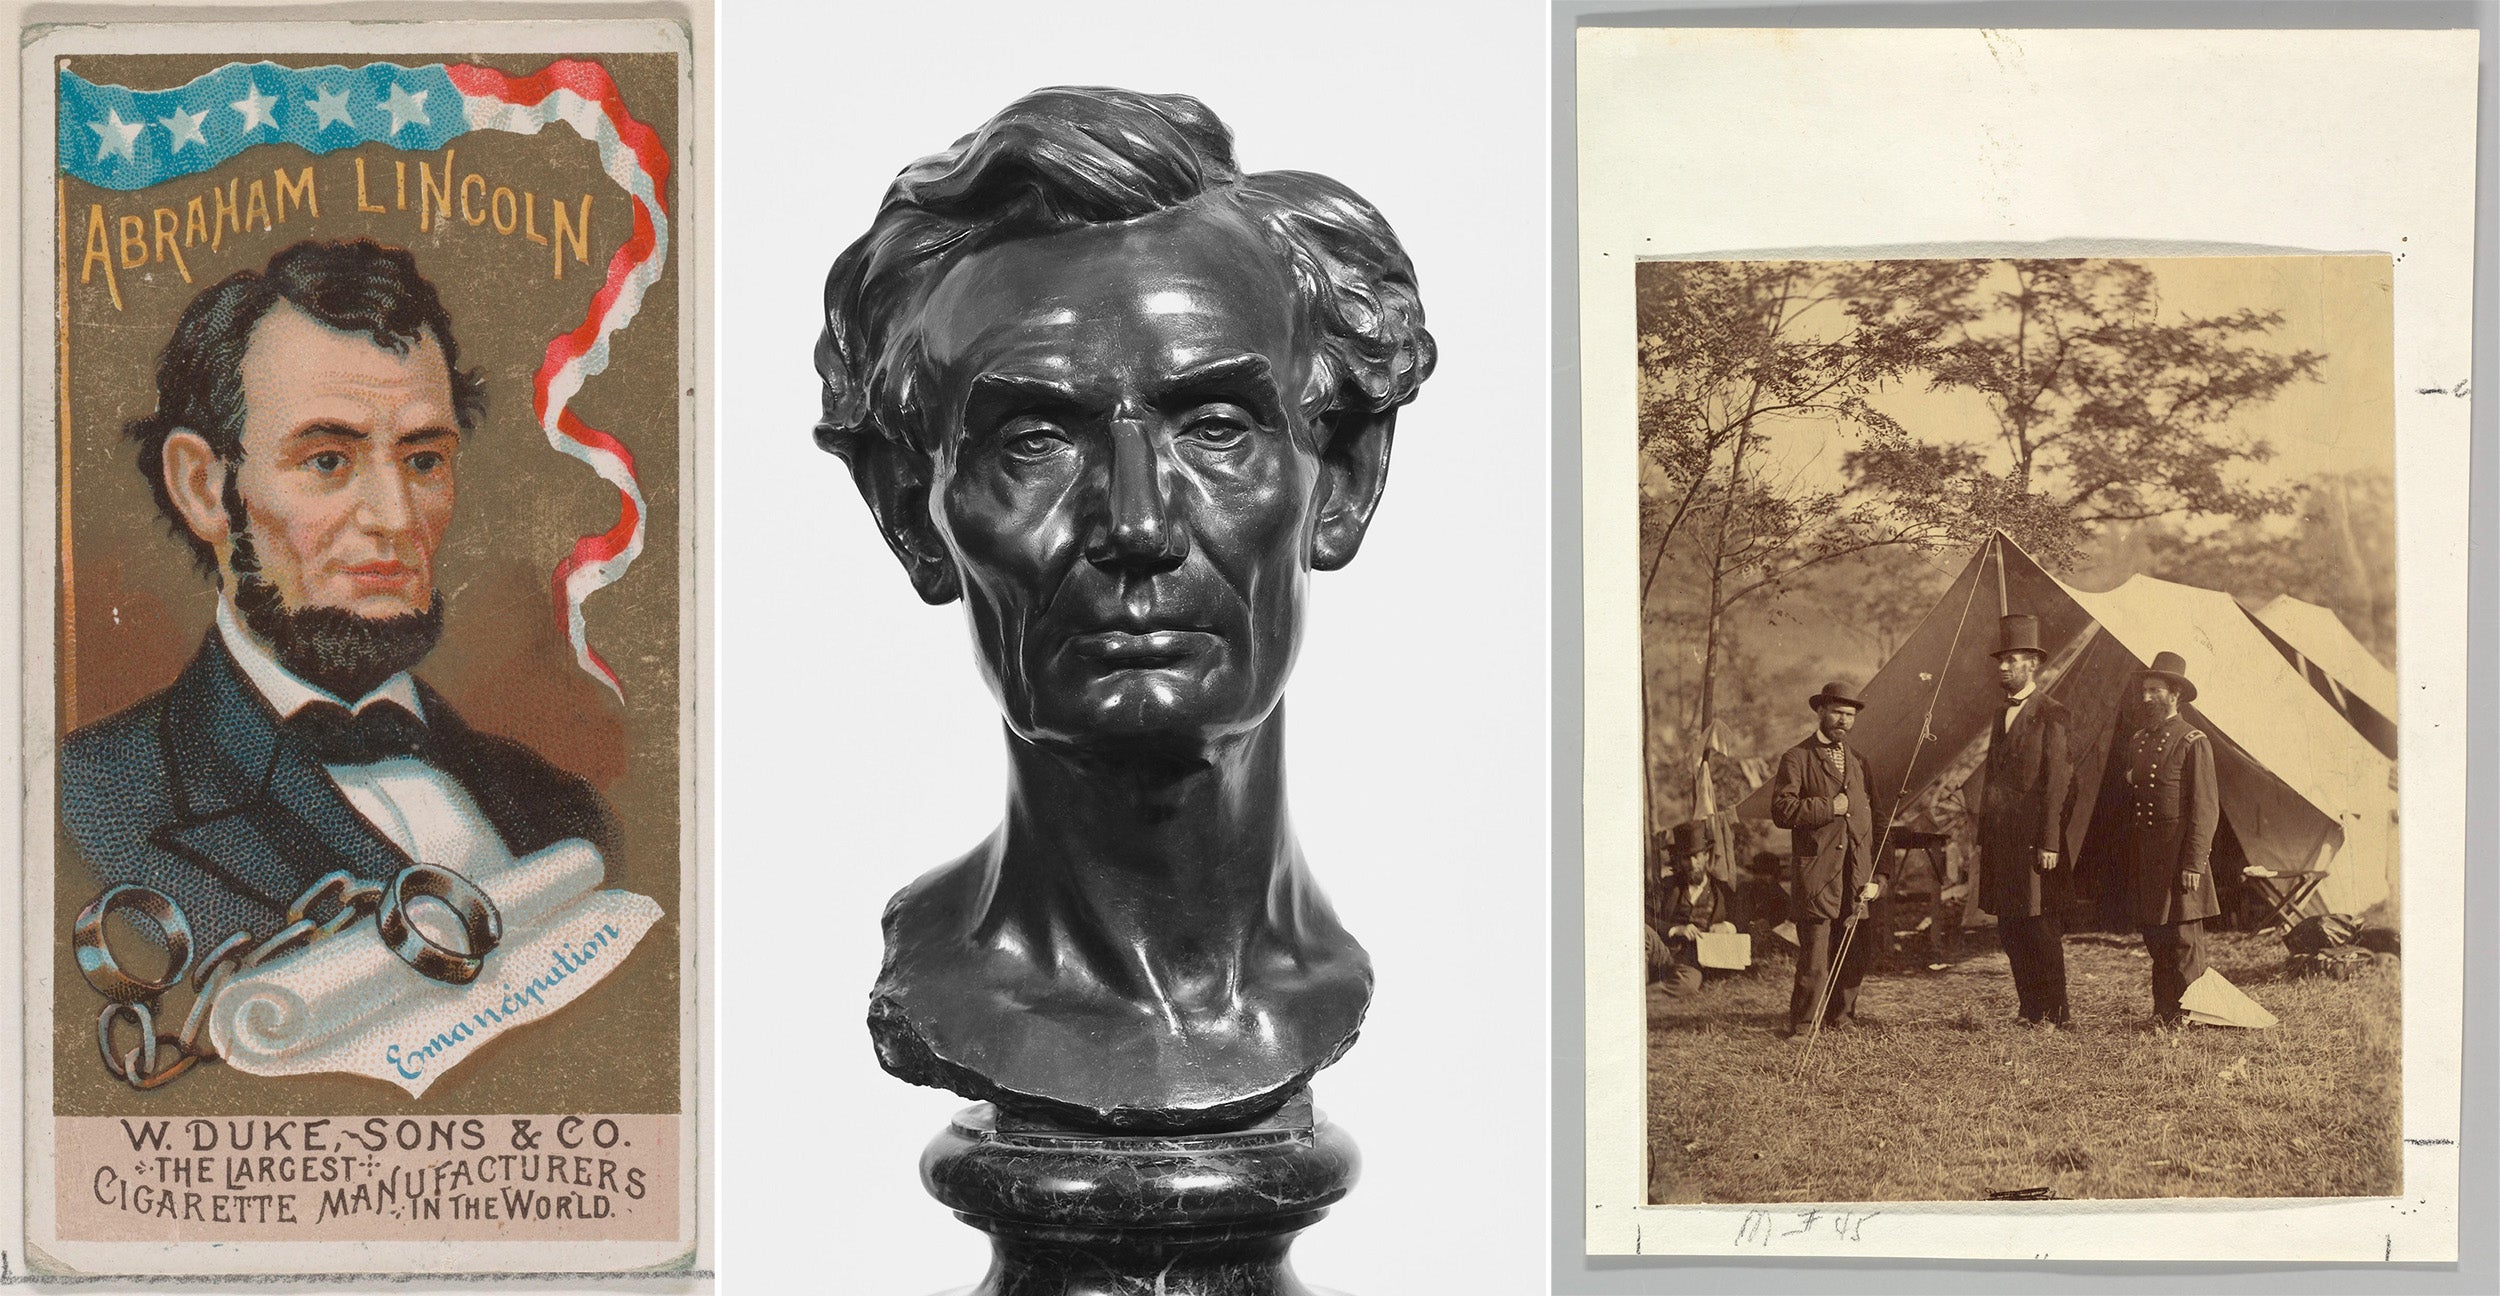
When it comes to recognizing what kind of visual information you need to better understand a topic, it’s important to consider contextual factors such as the age and material of the image. A painting of a king in regalia from a historical period might offer valuable insights into the culture and customs around royalty of that time. Conversely, a more recent image of the same garments on display provides access to greater detail about the king’s clothing but loses some of the historical context and emphasis provided by the artist.
Age also affects the kind of information you can glean from an image. Are you attempting to understand a historical moment? Images produced at that time will provide something closer to a firsthand account, influenced by contemporaneous beliefs and contexts, while an image created much later will be interpreting and reflecting that moment with the benefit of hindsight.
Consider also the genre or format of image you are seeking. Different media types , such as photographs, illustrations, or infographics, can offer different information about a topic. For example, an infographic might provide a succinct summary of complex data while a photograph might offer a window into a specific event or moment. A work of art may provide a more emotional or visceral connection to a particular topic.
Who Made the Image?
It’s crucial to build an understanding of authorship and different perspectives. Think about who is creating and sharing the images and what their goals and motivations might be. We may also consider the creator’s personal beliefs, the context in which the image was created, and other factors that may shape an image.
We’ve discussed authorship in the context of bias and seeking multiple viewpoints , but it’s also beneficial to consider when you’re determining where to look for images. When seeking visual information, we often need a particular perspective.
Where Should You Look for Quality Images?
Just like finding images from various types of creators yields distinct results, you get different kinds of images depending on where you look for them. Although there are innumerable image resources available and easily accessible online, it’s important to seek out reliable and high-quality sources. These aren’t necessarily difficult to find and are usually free to use. Depending on your need, resources might include stock photo websites, public domain image collections, institutional archives—like museums or universities —and more. It’s also important to consider the context in which the image will be used, as certain sources might not allow for commercial use or might require attribution.
There are many resources available that provide access to high-quality images online, including:
- The Library of Congress has a vast collection of digitized images—including photographs, maps, and prints—from its own collections as well as other institutions. The images cover a wide range of topics, including American history, world cultures, and science and technology.
- AP Newsroom offers a vast archive of contemporary and historical news photos, covering a wide range of events and subjects from around the world. With a focus on journalism, this resource provides a window into the major news events of the past and present.
- Europeana is a digital library of cultural heritage collections from across Europe, including images, videos, and audio recordings.
- Getty Images is a commercial stock image company that also offers a large selection of historical images, including photographs, illustrations, and artwork. While not all images are free, Getty Images offers a substantial selection of images that can be licensed for use in research and educational settings.
- Digital Public Library of America provides access to millions of digitized materials from libraries, archives, and museums across the United States. It includes a collection of historical images, including photographs, maps, and documents.
- Asia Art Archive collects and provides access to materials related to contemporary art and visual culture in Asia, including photographs, documents, and artworks.
- Digital South Asia Library , from the University of Chicago, provides access to digital materials related to South Asia, including historical photographs, manuscripts, and books from the nineteenth and twentieth centuries. In addition, the South Asia Open Archives (SAOA) is a collaborative, open-access resource for research, teaching, and learning about South Asia.
- Trove , provided by the National Library of Australia, includes a large collection of digitized historical images, including photographs, artworks, and maps, from Australia and the Pacific region covering a wide range of topics, including Australian history, culture, and society.
- Openverse is a Creative Commons search engine that allows users to find and use openly licensed images and other media for a variety of uses.
These are just a few examples of online resources that provide access to historical and contemporary images from across the world. Some of these and many other historical collections are also part of JSTOR Collections , providing an access point to explore a wide variety of visual material that you likely won’t find through Google. Exploring these and other sources can broaden your perspective on historical topics and discover unique images that can enhance your research.
By forming a clearer understanding of your initial needs as well as the likely context and sources in which relevant images may be found and used, you can better identify and locate the types of images that will best serve you. Actively seeking out reliable and high-quality sources will ensure that the images you use are accurate, ethical, and effective in enhancing your understanding of a topic.
In the next article, we’ll dive deeper into strategies for effectively finding the best images. In the meantime, try exploring JSTOR Collections and considering which of the images you find there might meet your research needs.
Support JSTOR Daily! Join our new membership program on Patreon today.
JSTOR is a digital library for scholars, researchers, and students. JSTOR Daily readers can access the original research behind our articles for free on JSTOR.
Get Our Newsletter
Get your fix of JSTOR Daily’s best stories in your inbox each Thursday.
Privacy Policy Contact Us You may unsubscribe at any time by clicking on the provided link on any marketing message.
More Stories

- The Genius of Georgette Chen

From Saint to Stereotype: A Story of Brigid

Christy’s Minstrels Go to Great Britain

Searching for Home in Hmong American Writing
Recent posts.
- Beware the Volcanoes of Alaska (and Elsewhere)
- Seeing the World Through Missionaries’ Eyes
- The Border Presidents and Civil Rights
- Eurasianism: A Primer
Support JSTOR Daily
Sign up for our weekly newsletter.
Educational resources and simple solutions for your research journey

Research Infographics: Advantages and Tips to Create Impactful Visuals
Human beings are visual creatures, and this is where research infographics come into play. According to an interesting study, 90% of the information transmitted to the brain is visual. 1 In fact, humans are capable of processing visuals 60,000 times faster than text. 2 This is why the use of research infographics is an important and popular way to communicate complex scientific information in a simple, easy-to-understand way. Using appropriate visuals when writing your manuscript is a great way to enhance your research effectiveness and reach, ensuring it is read and understood by a wider audience. In this article, we will explore the importance of using research infographics, how it can help improve your article, and how to present data in research infographics effectively.
Table of Contents
What is a research infographic?
Infographics are visual representations of data, information, or knowledge that can help researchers and authors to communicate complex concepts in a way that is simple, engaging, and effective. By using research infographics, researchers can ensure that readers are able to understand and retain key messages faster and more efficiently. The clear, concise representation of data can reinforce your arguments, provide context, highlight the significance of your findings, and adding credibility to your work. This was confirmed by a study undertaken by Cornell University, which found that if a scientific claim is presented in simple text or numerical values, 68% of people will believe that the information is accurate and truthful. But if you add a simple visual or infographic to the claim, the number rises to 97%! 3
Advantages of using research infographics
Research infographics leverage the power of visual representation to convey complex data and ideas in a concise and engaging manner. Here’s why they are an excellent addition to your research article:
Helps simplify complex scientific processes and concepts
Many academic writers find it difficult to convey complex scientific concepts and processes, which is where visuals work best. Breaking down concepts into easily digestible research infographics allows readers to quickly grasp the key takeaways of your research, driving greater impact than using just hard statistics. A good example here would be the simple visualization of complex scientific processes to show how certain results were achieved.
Enhances comprehension and retention of data
By combining text and visuals, research infographics cater to different learning styles, enhancing the overall understanding and retention of your research findings. For example, a line graph of increasing levels of stress in academia can help visualize the growth of the phenomenon more easily.
Grabs the readers’ attention and interest quickly
In text-heavy research papers, research infographics stand out and capture readers’ attention by conveying relevant information quickly, compelling them to delve deeper into your article. One impactful research infographic example is emphasizing the effect of drastic climate change through well-designed visuals that convey the speed at which our icebergs are melting.
Broadens the audience reach of your research
Visual tools like research infographics employ colors, fonts, shapes, and symbols to highlight and convey the most relevant findings of your research, while also clearly defining its implications. This helps to transcend language barriers, making your research more accessible to a global audience, including those with diverse language backgrounds. For example, using graphs and charts to visualize trends, correlations, and patterns in your data work better than text to convey the significance of your findings.
How to create effective research infographics
Creating impactful research infographics doesn’t have to be daunting. Follow these simple steps to craft compelling visuals for your research article:
- Define the purpose and audience: Before you start creating your research infographic, identify who it is meant for and what it is meant to convey. This will determine the type of infographic, the information to be included, and dictate the final design.
- Gather and organize the data: Next, organize and arrange the information in a logical and coherent manner. Ensure a clear flow that guides readers through your research findings without confusion.
- Choose a suitable format: Select visual elements and formats (timelines, maps, charts, images, graphs, etc.) that best represent your data and complement your research narrative effectively.
- Design the infographic: Avoid information overload and stick to a clean minimalistic design layout that highlights the core message. Be careful not to overwhelm of distract the audience with fancy fonts, random icons, and irrelevant images. Use colors to enhance the visual appeal and emphasize key points.
- Cite sources correctly: Accurately cite the sources used at the end of the research infographic or within the infographic itself. By giving credit to original authors you can help avoid any plagiarism.
Mistakes to avoid when creating research infographics
While research infographic can be a valuable addition to your research article, beware of these common mistakes.
- Misleading representation: Ensure your visual representations accurately reflect the data and take care to avoid any manipulation that may mislead readers.
- Inadequate labeling: Provide clear and concise labels for each element in your research infographic, ensuring easy comprehension.
- Overcrowding data: Avoid cramming too much information into a single research infographic or it could leave the reader confused. Instead, create multiple infographics to maintain clarity.
- Ignoring accessibility: Make your research infographics accessible to readers across the globe by providing alternative text descriptions for images and graphics.
Clearly, the use of visuals and infographics in academic writing can be powerful tools for conveying complex concepts and data as it allows us to process different types of patterns more easily than text and therefore, they must be an important addition to papers and manuscripts submitted by researchers.
References:
- Alexis, C. 29 Incredible Stats that Prove the Power of Visual Marketing. Movable Ink, October 2022. Available at https://movableink.com/blog/29-incredible-stats-that-prove-the-power-of-visual-marketing
- Words Of Wisdom: Using Data Visualization For Data Storytelling, CSpring Blog. Available at https://cspring.com/data-visualization-for-data-storytelling/
- S. Fotis Jr. The Power of Data Visualization. Aegis IT Research website, May 2020. Available at https://aegisresearch.eu/the-power-of-data-visualization/
Researcher.Life is a subscription-based platform that unifies top AI tools and services designed to speed up, simplify, and streamline a researcher’s journey, from reading to writing, submission, promotion and more. Based on over 20 years of experience in academia, Researcher.Life empowers researchers to put their best research forward and move closer to success.
Try for free or sign up for the Researcher.Life All Access Pack , a one-of-a-kind subscription that unlocks full access to an AI academic writing assistant, literature reading app, journal finder, scientific illustration tool, and exclusive discounts on professional services from Editage. Find the best AI tools a researcher needs, all in one place – Get All Access now at just $25 a month or $199 for a year !
Related Posts

Essay Writing Basics: Strategies for PhD Success

Streamlining the Research Funding Journey With Researcher.Life’s GrantDesk
No internet connection.
All search filters on the page have been cleared., your search has been saved..
- All content
- Dictionaries
- Encyclopedias
- Expert Insights
- Foundations
- How-to Guides
- Journal Articles
- Little Blue Books
- Little Green Books
- Project Planner
- Tools Directory
- Sign in to my profile My Profile
- Sign in Signed in
- My profile My Profile
The SAGE Handbook of Visual Research Methods
- Edition: Second
- Edited by: Luc Pauwels & Dawn Mannay
- Publisher: SAGE Publications, Inc.
- Publication year: 2020
- Online pub date: January 22, 2020
- Discipline: Sociology
- Methods: Visual research , Photographs , Video research
- DOI: https:// doi. org/10.4135/9781526417015
- Keywords: film , films , photography , publications , social media , sociology , videos Show all Show less
- Print ISBN: 9781473978003
- Online ISBN: 9781526417015
- Buy the book icon link
Subject index
The second, thoroughly revised and expanded, edition of The SAGE Handbook of Visual Research Methods presents a wide-ranging exploration and overview of the field today. As in its first edition, the Handbook does not aim to present a consistent view or voice, but rather to exemplify diversity and contradictions in perspectives and techniques. The selection of chapters from the first edition have been fully updated to reflect current developments. New chapters to the second edition cover key topics including picture-sorting techniques, creative methods using artefacts, visual framing analysis, therapeutic uses of images, and various emerging digital technologies and online practices. At the core of all contributions are theoretical and methodological debates about the meanings and study of the visual, presented in vibrant accounts of research design, analytical techniques, fieldwork encounters and data presentation. This handbook presents a unique survey of the discipline that will be essential reading for scholars and students across the social and behavioural sciences, arts and humanities, and far beyond these disciplinary boundaries. The Handbook is organized into seven main sections: PART 1: FRAMING THE FIELD OF VISUAL RESEARCH; PART 2: VISUAL AND SPATIAL DATA PRODUCTION METHODS AND TECHNOLOGIES; PART 3: PARTICIPATORY AND SUBJECT-CENTERED APPROACHES; PART 4: ANALYTICAL FRAMEWORKS AND PERSPECTIVES; PART 5: MULTIMODAL AND MULTISENSORIAL RESEARCH; PART 6: RESEARCHING ONLINE PRACTICES; and PART 7: COMMUNICATING THE VISUAL: FORMATS AND CONCERNS.
Front Matter
- List of Figures
- List of Tables
- Notes on the Editors and Contributors
- Acknowledgements
- Chapter 1 | Visual Dialogues Across Different Schools of Thought
- Chapter 2 | An Integrated Conceptual and Methodological Framework for the Visual Study of Culture and Society
- Chapter 3 | Looking Two Ways: Mapping the Social Scientific Study of Visual Culture
- Chapter 4 | Visual Studies and Empirical Social Inquiry
- Chapter 5 | Seeing Things: Visual Research and Material Culture
- Chapter 6 | Rephotography for Documenting Social Change
- Chapter 7 | Rephotography in Landscape Research
- Chapter 8 | Videography: An Interpretative Approach to Video-Recorded Micro-Social Interaction
- Chapter 9 | Eye-Tracking as a Method of Visual Research
- Chapter 10 | Expanding Cartographic Practices in the Social Sciences
- Chapter 11 | Participatory Geographic Information Systems in Visual Research
- Chapter 12 | Visualization in Social Analysis
- Chapter 13 | Visual Research Methods in the Design Process
- Chapter 14 | Methodological Variation in Participant Visual Media Production
- Chapter 15 | Community-Based Participatory Video and Social Action
- Chapter 16 | Digital Storytelling as a Research Method
- Chapter 17 | Photovoice: A Critical Introduction
- Chapter 18 | Using Drawing in Visual Research: Materializing the Invisible
- Chapter 19 | Picture-Sorting Techniques: Card-Sorting and Q-Sort as Alternative and Complementary Approaches in Visual Social Research
- Chapter 20 | Artefacts, Third Objects, Sandboxing and Figurines in the Doll's House
- Chapter 21 | The Therapeutic Use of Photography: Phototherapy and Therapeutic Photography
- Chapter 22 | Quantitative Content Analysis of the Visual
- Chapter 23 | Visual Semiotics: Key Concepts and New Directions
- Chapter 24 | Advances in Visual Rhetorical Analysis
- Chapter 25 | Iconology and Documentary Method in the Interpretation of Divergent Types of Visual Materials
- Chapter 26 | Ethnomethodology and the Visual Practices of Looking, Visualization, and Embodied Action
- Chapter 27 | Methodological Approaches to Disclosing Historic Photographs
- Chapter 28 | Researching Film and History: Sources, Methods, Approaches
- Chapter 29 | Multimodality and Multimodal Research
- Chapter 30 | Visual and Multimodal Framing Analysis
- Chapter 31 | Multimodal Critical Discourse Analysis: How to Reveal Discourses of Health and Ethics in Food Packaging
- Chapter 32 | How to ‘Read’ Images with Texts: The Graphic Novel Case
- Chapter 33 | A Multisensory Approach to Visual Methods
- Chapter 34 | Rapid Prototyping for Social Science Research
- Chapter 35 | A Multimodal Model for Exploring the Material Culture of Digital Networked Platforms and their Practices
- Chapter 36 | Contemporary Landscapes of Visual and Digital Communication: The Interplay of Social, Semiotic, and Technological Change
- Chapter 37 | Understanding Online Images: Content, Context and Circulation as Analytic Foci
- Chapter 38 | Visual and Affective Analysis of Social Media
- Chapter 39 | Creating Visual Essays: Narrative and Thematic Approaches
- Chapter 40 | Anthropological Filmmaking: An Empirical Art
- Chapter 41 | Visual Ethnography and Emerging Digital Technologies
- Chapter 42 | Revisualizing Data: Engagement, Impact and Multimodal Dissemination
- Chapter 43 | Making Arguments with Images: Visual Scholarship and Academic Publishing
- Chapter 44 | Visual Ethics Beyond the Crossroads
- Chapter 45 | Legal Issues of Using Images in Research
Sign in to access this content
Get a 30 day free trial, more like this, sage recommends.
We found other relevant content for you on other Sage platforms.
Have you created a personal profile? Login or create a profile so that you can save clips, playlists and searches
- Sign in/register
Navigating away from this page will delete your results
Please save your results to "My Self-Assessments" in your profile before navigating away from this page.
Sign in to my profile
Sign up for a free trial and experience all Sage Learning Resources have to offer.
You must have a valid academic email address to sign up.
Get off-campus access
- View or download all content my institution has access to.
Sign up for a free trial and experience all Sage Research Methods has to offer.
- view my profile
- view my lists
Visual Communication Research Paper Topics

- Amateur Photography and Movies
- Art as Communication
- Cartography
- Cinematography
- Community Video
- Digital Imagery
- Documentary Film
- Ethnographic Film
- Film Genres
- Film Production
- Film Theory
- Graphic Design
- Hong Kong Cinema
- Iconography
- Image Ethics
- Infographics
- Photography
- Photojournalism
- Pictorial Perspective
- Picture Magazines
- Portraiture
- Realism in Film and Photography
- Scopic Regime
- Sign Systems
- Special Effects
- Spectator Gaze
- Stock Photography
- Structuralism in Visual Communication
- Taste Culture
- Visual Characteristics of Advertisement
- Visual Characteristics of Television
- Visual Communication of Propaganda
- Visual Components of News
- Visual Culture
- Visual Design of Magazine
- Visual Design of Newspaper
- Visual Representation
The Pictorial Turn
The rise of contemporary visual communication studies was preceded by centuries of thought and writing concerning the arts and the visual image. Yet the last decades of the twentieth century saw a renewed philosophical concern with the visual that Mitchell (1994) calls “the pictorial turn.” This increased attention to the visual can be seen as an outgrowth of scholarship on photography, which since the middle of the nineteenth century has continually explored and revisited the nature of the photographic image as a reflection of reality. Whether couched in terms of art vs. science, pictorial expression vs. mechanical record, or trace vs. transformation, the practice of photography has been dogged by ongoing contradictions between the craft of picture-making and the status of photographs as technological recording. Similarly, the extensive literature of film theory has revolved around questions of cinema’s proper aesthetic status.
Academic Writing, Editing, Proofreading, And Problem Solving Services
Get 10% off with 24start discount code.
An important foundation for the development of visual communication studies, film theory synthesized a body of concepts and tools borrowed from the study of art, psychology, sociology, language, and literature, and work in visual communication has often returned to these various sources for new applications to photography, design, electronic imaging, or virtual reality. Central issues have included the distinction between formative and realist theories, and the scope and centrality of narrative, issues that have preoccupied the philosophy of representation more generally.
Theoretical Approaches
The precise nature of visual images as copies or records continues to be a defining issue for visual communication studies in an era of ubiquitous photo-electronic reproduction, with various technical advances promising ever more convincing images and simulations of the external world. Against the commonsense assumptions so often made that visual media give us a window on reality, from the beginning photography and film studies have interrogated the ways in which such ‘windows’ are created and structured to shape our view.
British cultural studies also incorporated work on film and photography to analyze the culturally constructed nature of visual representation, what many Anglo scholars increasingly called ‘lens theory.’ Concurrently, interest in the psychology of the visual made its way through art history to visual media studies. For instance, Gombrich makes the case that picture forms of all kinds are conventionally constructed according to learned schemata, not simply copied from nature. Pictures rarely stand alone, and rarely communicate unambiguously when they do. Together with film theory, semiotics, and the social history of art, the psychology of visual representation has contributed to an eclectic body of theory and research on which communications scholars have drawn for conceptualizing approaches to visual communication analysis.
The social history of art offers models for investigating relationships between the production of images and the social contexts of their sponsorship, use, and interpretation. Alpers has explored the relation between picture- making and description. Baxandall’s (1972) study of painting and experience in fifteenth- century Italy provides a historical ethnography of patronage, contractual obligations, and viewer expectations, mapping a social world of visual communication. Becker’s Art Worlds (1982) applies a similar approach to twentieth-century social worlds of artistic production, with specific attention paid to photography.
Related to these extra-textual studies of visual communication practice and meaning is a long history of attention to the intertextual relationships between word and image. Whether in studies of the relationship between religious painting and scripture, pictures and narrative, or in attempts to pursue the study of iconology (the general field of images and their relation to discourse), the existence of pictures within larger multi-textual contexts has led to several rich traditions of scholarship.
Influenced by these parallel developments, social communication theorists in anthropology and sociology took an interest in the social and discursive role of visual images. In the 1960s and 1970s scholars studied the cultural codes and social contexts of image-making within particular communities, sub-cultures, and social groups. This movement was influenced by work in the psychology of art and representation, film theory, symbolic interactionism, semiotics, and the social history of art.
Current and Future Research Topics
The key issues for visual communication in the new millennium are surprisingly similar to those of 30 years ago, although greater attention is being paid to these issues within communications studies itself. A still largely unmet challenge for visual communication scholars is to scan, chart, and interrogate the various levels at which images seem to operate: as evidence in visual rhetoric, as simulated reality bolstering and legitimizing the presence and status of media operations themselves, as abstract symbols and textual indices, or as ‘stylistic excess’ – the self-conscious performance of style. These issues are perhaps more significant than ever for the processes of ‘remediation’ that characterize new digital media and the emphases on ‘transparent immediacy’ and ‘hypermediacy’ that distinguish digital visualization.
There is an issue of particular concern to visual communication researchers as we proceed into an era of increasingly convincing virtual realism on the one hand, and an increasingly systemic textualization of images in cyberspace on the other. It is not just what we can do with new digital technologies of manipulation but to what purposes we seek to use the production of images in a ‘post-photographic age.’
Finally, in that emerging condition often referred to as the ‘global media environment’, visual images have become a new sort of transnational cultural currency. Not the ‘universal language’ that promoters such as Eastman Kodak claimed for photography earlier in the century, but a currency of media control and power, indices of the predominant cultural visions of predominant media industries.
References:
- Alpers, S. (1983). The art of describing: Dutch art in the seventeenth century. Chicago, IL: University of Chicago Press.
- Baxandall, M. (1972). Painting and experience in fifteenth- century Italy. Oxford: Oxford University Press.
- Becker, H. S. (1982). Art worlds. Berkeley, CA: University of California Press.
- Gombrich, E. H. (1972). The visual image. Scientific American, 227(3), 82–96.
- Griffin, M. (ed.) (1992). Visual communication studies in mass media research, Parts I and II. Communication (special double issue), 13(2/3).
- Gross, L. (1981). Introduction. In S. Worth, Studying visual communication. Philadelphia, PA : University of Pennsylvania Press, pp. 1–35.
- Lester, P. (2013). Visual communication: Images with messages, 6th edn. Andover: Cengage Learning.
- Mitchell, W. J. T. (1994). Picture theory. Chicago, IL: University of Chicago Press.
- Worth, S. (1981). Studying visual communication. Philadelphia, PA : University of Pennsylvania Press.
Back to Communication Research Paper Topics .
ORDER HIGH QUALITY CUSTOM PAPER

Exploring the World of 250+ Interesting Topics to Research

Research is a fascinating journey into the unknown, a quest for answers, and a process of discovery. Whether you’re an academic, a student, or just a curious mind, finding the right and interesting topics to research is paramount. Not only does it determine the success of your research project, but it can also make the experience enjoyable.
In this blog, we’ll delve into the art of selecting interesting topics to research, particularly catering to the average reader.
How to Select Interesting Topics to Research?
Table of Contents
Choosing a research topic is like setting sail on a ship. It’s a decision that will dictate your course, so you must make it wisely. Here are some effective strategies to help you pick a captivating topic:
- Personal Interests: Researching a topic you’re genuinely passionate about can turn the entire process into an exciting adventure. Your enthusiasm will show in your work and make it more engaging for the reader.
- Current Trends and Issues: Current events and trends are always intriguing because they’re relevant. They often raise questions and uncertainties, making them excellent research candidates. Think of topics like the impact of a global pandemic on mental health or the evolution of renewable energy technologies in the face of climate change.
- Problem-Solving Approach: Identify a problem that needs a solution or an unanswered question. Researching with the aim to solve a real-world issue can be highly motivating. For instance, you could explore strategies to reduce plastic waste in your community.
- Impact and Relevance: Consider the significance of your topic. Will it impact people’s lives or contribute to existing knowledge? Research with a purpose tends to be more engaging. Topics like gender equality, public health, or environmental conservation often fall into this category.
- Unexplored or Unique Topics: Researching less-explored or unique topics can be exciting. It gives you the opportunity to contribute something new to your field. Remember, research isn’t limited to established subjects; there’s room for exploration in every discipline.
250+ Interesting Topics to Research: Popular Categories
Research topics come in various flavors. Let’s explore some popular categories, which are often engaging for average readers:
Science and Technology
- Artificial intelligence in healthcare.
- Quantum computing advancements.
- Space exploration and colonization.
- Genetic editing and CRISPR technology.
- Cybersecurity in the digital age.
- Augmented and virtual reality applications.
- Climate change and mitigation strategies.
- Sustainable energy sources.
- Internet of Things (IoT) innovations.
- Nanotechnology breakthroughs.
- 3D printing in various industries.
- Biotechnology in medicine.
- Autonomous vehicles and self-driving technology.
- Robotics in everyday life.
- Clean water technology.
- Renewable energy storage solutions.
- Wearable technology and health tracking.
- Green architecture and sustainable design.
- Bioinformatics and genomics.
- Machine learning in data analysis.
- Space tourism development.
- Advancements in quantum mechanics.
- Biometrics and facial recognition.
- Aerospace engineering innovations.
- Ethical considerations in AI development.
- Artificial organs and 3D bioprinting.
- Holography and holographic displays.
- Sustainable agriculture practices.
- Climate modeling and prediction.
- Advancements in battery technology.
- Neurotechnology and brain-computer interfaces.
- Space-based solar power.
- Green transportation options.
- Materials science and superconductors.
- Telemedicine and remote healthcare.
- Cognitive computing and AI ethics.
- Renewable energy policy and regulation.
- The role of 5G in the digital landscape.
- Precision medicine and personalized treatment.
- Advancements in quantum cryptography.
- Drone technology and applications.
- Environmental sensors and monitoring.
- Synthetic biology and bioengineering.
- Smart cities and urban planning.
- Quantum teleportation research.
- AI-powered virtual assistants.
- Space-based mining and resource extraction.
- Advancements in neuroprosthetics.
- Sustainable transportation solutions.
- Blockchain technology and applications.
Social Issues
- Gender inequality in the workplace.
- Racial discrimination and systemic racism.
- Income inequality and wealth gap.
- Climate change and environmental degradation.
- Mental health stigma and access to care.
- Access to quality education.
- Immigration and border control policies.
- Gun control and Second Amendment rights.
- Opioid epidemic and substance abuse.
- Affordable healthcare and insurance.
- LGBTQ+ rights and discrimination.
- Cyberbullying and online harassment.
- Homelessness and affordable housing.
- Police brutality and reform.
- Human trafficking and modern slavery.
- Voter suppression and electoral integrity.
- Access to clean water and sanitation.
- Child labor and exploitation.
- Aging population and healthcare for the elderly.
- Indigenous rights and land disputes.
- Bullying in schools and online.
- Obesity and public health.
- Access to reproductive healthcare.
- Income tax policies and fairness.
- Mental health support for veterans.
- Child abuse and neglect.
- Animal rights and cruelty.
- The digital divide and internet access.
- Youth unemployment and opportunities.
- Religious freedom and tolerance.
- Disability rights and accessibility.
- Affordable childcare and parental leave.
- Food insecurity and hunger.
- Drug policy and legalization.
- Human rights violations in conflict zones.
- Aging infrastructure and public safety.
- Cybersecurity and data privacy.
- Human rights in authoritarian regimes.
- Environmental racism and pollution.
- Discrimination against people with disabilities.
- Income and education disparities in rural areas.
- Freedom of the press and media censorship.
- Bullying and discrimination against the LGBTQ+ youth.
- Access to clean energy and sustainable practices.
- Child marriage and forced unions.
- Mental health in the workplace.
- Domestic violence and abuse.
- Education funding and quality.
- Childhood obesity and healthy habits.
- Poverty and economic development.
History and Culture
- The Rise and Fall of the Roman Empire
- Ancient Egyptian Civilization
- The Renaissance Period in Europe
- The Industrial Revolution
- The French Revolution
- The American Civil War
- The Silk Road and Cultural Exchange
- The Mayan Civilization
- The Byzantine Empire
- The Age of Exploration
- World War I: Causes and Consequences
- The Harlem Renaissance
- The Aztec Empire
- Ancient Greece: Democracy and Philosophy
- The Vietnam War
- The Cold War
- The Inca Empire
- The Enlightenment Era
- The Crusades
- The Spanish Inquisition
- The African Slave Trade
- The Suffragette Movement
- The Black Death in Europe
- The Apollo Moon Landing
- The Roaring Twenties
- The Chinese Cultural Revolution
- The Salem Witch Trials
- The Great Wall of China
- The Abolitionist Movement
- The Golden Age of Islam
- The Mesoamerican Ballgame
- The Age of Vikings
- The Ottoman Empire
- The Cultural Impact of the Beatles
- The Space Race
- The Fall of the Berlin Wall
- The History of Hollywood Cinema
- The Renaissance Art and Artists
- The British Empire
- The Age of Samurai in Japan
- The Ancient Indus Valley Civilization
- The Russian Revolution
- The Age of Chivalry
- The History of Native American Tribes
- The Cultural Significance of Greek Mythology
- The Etruscans in Ancient Italy
- The History of African Kingdoms
- The Great Famine in Ireland
- The Age of Invention and Innovation
- The Cultural Impact of Shakespeare’s Works
Business and Economics
- Impact of E-commerce on Traditional Retail
- Global Supply Chain Challenges
- Green Business Practices and Sustainability
- Strategies for Small Business Growth
- Cryptocurrency and Its Economic Implications
- Consumer Behavior in the Digital Age
- The Gig Economy and Its Future
- Economic Consequences of Climate Change
- The Role of AI in Financial Services
- Trade Wars and Their Effects on Global Markets
- Entrepreneurship in Emerging Markets
- Corporate Social Responsibility Trends
- The Economics of Healthcare
- The Impact of Inflation on Savings
- Startup Ecosystems and Innovation Hubs
- Financial Literacy and Education Initiatives
- Income Inequality and Economic Mobility
- The Sharing Economy and Collaborative Consumption
- International Trade Policies
- Behavioral Economics in Marketing
- Economic Effects of the COVID-19 Pandemic
- Fintech Innovations and Banking
- Real Estate Market Trends
- Public vs. Private Healthcare Systems
- Market Entry Strategies for New Businesses
- Global Economic Growth Prospects
- The Economics of Education
- Mergers and Acquisitions Trends
- Impact of Tax Reforms on Businesses
- Sustainable Investing and ESG Factors
- Monetary Policy and Interest Rates
- The Future of Work: Remote vs. Office
- Business Ethics and Corporate Governance
- The Economics of Artificial Intelligence
- Stock Market Volatility
- Supply and Demand Dynamics
- Entrepreneurial Finance and Fundraising
- Innovation and Technology Transfer
- Competition in the Digital Marketplace
- Economic Impacts of Aging Populations
- Economic Development in Developing Countries
- Regulatory Challenges in the Financial Sector
- The Economics of Healthcare Insurance
- Corporate Profitability and Market Share
- Energy Economics and Renewable Sources
- Economic Factors in Mergers and Acquisitions
- Financial Crises and Their Aftermath
- Economics of the Entertainment Industry
- Global Economic Trends Post-Pandemic
- Economic Consequences of Cybersecurity Threats
- The Impact of Online Learning
- Strategies for Inclusive Education
- Early Childhood Development
- The Role of Teachers in Student Motivation
- Educational Technology Trends
- Assessment Methods in Education
- The Importance of Multilingual Education
- Special Education Approaches
- Global Education Disparities
- Project-Based Learning
- Critical Thinking in the Classroom
- Educational Leadership
- Homeschooling vs. Traditional Education
- Education and Social Inequality
- Student Mental Health Support
- The Benefits of Student Extracurricular Activities
- The Montessori Approach
- STEM Education
- Educational Policy Reforms
- Education for Sustainable Development
- Educational Psychology
- Learning Disabilities
- Adult Education Programs
- The Role of Arts in Education
- The Flipped Classroom Model
- Educational Gamification
- School Bullying Prevention
- Inclusive Curriculum Design
- The Future of College Admissions
- Early Literacy Development
- Education and Gender Equity
- Teacher Training and Professional Development
- Homeschooling Challenges
- Gifted and Talented Education
- Education for Global Citizenship
- Virtual Reality in Education
- Outdoor and Environmental Education
- Education for Sustainable Agriculture
- Music Education Benefits
- Education and Technological Divide
- Cultural Competence in Education
- Education and Social Emotional Learning
- Personalized Learning
- Educational Equity
- Restorative Justice in Schools
- Study Abroad Programs
- Education for Digital Citizenship
- The Role of Parents in Education
- Vocational Education and Training
- The History of Education Movements
Techniques for Researching Interesting Topics
Once you’ve chosen the interesting topics to research, you’ll need effective techniques to delve deeper into it:
- Online Databases and Journals: Online academic databases like Google Scholar, JSTOR, or PubMed are invaluable resources. They provide access to a vast pool of academic research papers.
- Interviews and Surveys: If your topic involves human perspectives, conducting interviews or surveys can offer firsthand insights. Tools like Jotform Survey Maker , SurveyMonkey or Zoom can be helpful.
- Libraries and Archives: Traditional libraries still hold a treasure trove of information. Whether you visit in person or explore digital archives, libraries can provide a wealth of resources.
- Online Forums and Social Media: Online communities and forums can be excellent sources of information, particularly for trending topics. Sites like Reddit and Quora can connect you with experts and enthusiasts.
- Academic and Expert Sources: Seek out academic articles, books, and experts in your field. Don’t hesitate to reach out to professionals who may be willing to share their expertise.
How to Make Your Research Engaging?
Once you’ve conducted your research, it’s essential to present it in a way that captures the interest of your average reader:
1. Clear and Accessible Language
Avoid jargon and complex terminology. Use simple and straightforward language to ensure your research is accessible to a wide audience.
2. Storytelling and Anecdotes
Weave stories and anecdotes into your research to make it relatable and engaging. Personal narratives and real-life examples can resonate with readers.
3. Visual Aids (Images, Infographics)
Incorporate visuals like images, charts, and infographics to make your research visually appealing and easier to understand.
4. Real-Life Examples and Case Studies
Use real-life examples and case studies to illustrate the practical applications of your research findings. This makes the information tangible and relevant.
5. Relatable Examples from Popular Culture
Relate your research to pop culture, current events, or everyday experiences. This helps readers connect with the material on a personal level.
Examples of Interesting Topics to Research
To provide some inspiration, let’s explore a few intriguing research topics:
The Impact of Social Media on Mental Health
Examine the relationship between social media use and mental health, including topics like social comparison, cyberbullying, and the benefits of online support networks.
The Future of Renewable Energy
Research the latest advancements in renewable energy technologies, such as solar power, wind energy, and the feasibility of a global transition to sustainable energy sources.
The History of Women’s Suffrage
Delve into the historical struggles and milestones of the women’s suffrage movement, both in the United States and around the world.
The Role of Artificial Intelligence in Healthcare
Investigate the applications of AI in healthcare, from diagnosis algorithms to patient data analysis and the ethical implications of AI in medical practice.
Strategies for Sustainable Business Practices
Examine business sustainability practices , exploring how companies can balance profit and environmental responsibility in an increasingly eco-conscious world.
Challenges you Might Face in Research
While you are looking for interesting topics to research, it’s important to be aware of the challenges:
- Avoiding Bias and Misinformation: Ensure your research is unbiased and based on credible sources. Critical thinking is key to avoiding misinformation.
- Ethical Considerations: Research involving humans or animals should follow ethical guidelines. Always prioritize ethical research practices.
- Data Collection and Analysis: Data collection can be time-consuming and challenging. Make sure to use appropriate data collection methods and robust analysis techniques.
- Staying Updated with Latest Research: Research is an ongoing process. Stay up-to-date with the latest research in your field to ensure the relevance and accuracy of your work.
Research is a gateway to knowledge, innovation, and solutions. Choosing interesting topics to research is the first step in this exciting journey. Whether you’re exploring the depths of science, the intricacies of culture, or the dynamics of business, there’s a captivating research topic waiting for you.
So, start your exploration, share your discoveries, and keep the flame of curiosity alive. The world is waiting to learn from your research.
Related Posts

Step by Step Guide on The Best Way to Finance Car

The Best Way on How to Get Fund For Business to Grow it Efficiently
Articles on Visual arts
Displaying 1 - 20 of 166 articles.

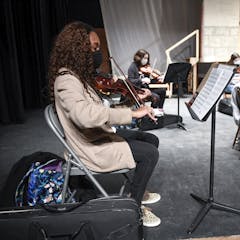
Making short films is a powerful way to learn job skills: 5 ways it prepares students for work
Wendy Smidt , Cape Peninsula University of Technology and Zayd Waghid , Cape Peninsula University of Technology
Take risks, embrace failure and be comfortable with uncertainty: 3 activities to help your child think like an artist
Naomi Zouwer , University of Canberra

Holiday help! An art expert suggests screen-free things to do in every room of the house

How to set up a kids’ art studio at home (and learn to love the mess)
AI image generation is advancing at astronomical speeds. Can we still tell if a picture is fake?
Brendan Paul Murphy , CQUniversity Australia

Male artists dominate galleries. Our research explored if it’s because ‘women don’t paint very well’ – or just discrimination
Robert Hoffmann , RMIT University and Bronwyn Coate , RMIT University
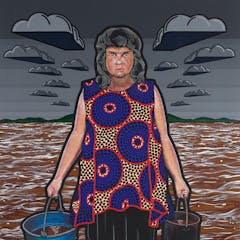
‘I can’t think of a more timely painting’: Blak Douglas’s Moby Dickens is a deserving winner of the 2022 Archibald Prize
Joanna Mendelssohn , The University of Melbourne
COVID-19 threatens the already shaky status of arts education in schools
Ryan D. Shaw , Michigan State University

Art, drama and music lower stress. Here’s what you need to know if you’re thinking of taking arts in years 11 and 12
Shelley Hannigan , Deakin University

The art of Aphantasia: how ‘mind blind’ artists create without being able to visualise
Matthew MacKisack , University of Exeter

‘I think Archie would be pleased’: 100 years of our most famous portrait prize and my almost 50 years watching it evolve
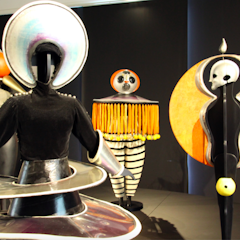
If I could go anywhere: German Modernism at the Staatsgalerie in Stuttgart — beauty, play and the horror of war
Emily Brayshaw , University of Technology Sydney

Guy Pearce shines, but The Last Vermeer paints over the remarkable true story of the world’s most successful art forger
Ted Snell , Edith Cowan University

Street art in a white cube: Rone at Geelong Gallery marries ephemeral beauty with a proven formula
Chris Honig , The University of Melbourne

Polar bears have captivated artists’ imaginations for centuries, but what they’ve symbolized has changed over time
Anne Collins Goodyear , Bowdoin College

Why weren’t there any great women artists? In gratitude to Linda Nochlin
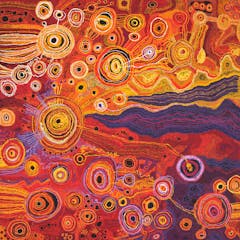
Beauty and audacity: Know My Name presents a new, female story of Australian art
Dobell Biennial showcases drawing today as we consider its future in the real world
Ari Chand , University of Newcastle

The Body Electric review: an erotic centring of the female gaze at the National Gallery of Australia
Cherine Fahd , University of Technology Sydney

The arts needed a champion – it got a package to prop up the major players 100 days later
Jo Caust , The University of Melbourne
Related Topics
- Archibald prize
- Art history
- Arts review
- Arts reviews
- Australian art
- Indigenous art
- Photography
Top contributors

Honorary (Senior Fellow) School of Culture and Communication University of Melbourne. Editor in Chief, Design and Art of Australia Online, The University of Melbourne

Honorary Professor, Edith Cowan University

Adjunct Professor of Art History, Australian National University

Course Leader and Fine Art Programme Director, University of the Arts London

Honorary Lecturer, School of Literature, Languages and Linguistics, Australian National University

Visual Artist and Lecturer in Teacher Education, University of Canberra

Professor in Art, Curtin University

Author and Research Fellow, UNSW Sydney

Honorary Professor, DVCE Portfolio, Deakin University

Professor emerita of the Social and Critical Histories of Art, University of Leeds

Junior Research Fellow in Art History, University of Oxford

Artist, Curator, Producer, RMIT University

Honorary Senior Lecturer, Australian National University

Senior Lecturer in History & Theory of Art & Design, Bath Spa University

Artist in Residence, Department of Physics, Imperial College London
- X (Twitter)
- Unfollow topic Follow topic

An official website of the United States government
The .gov means it’s official. Federal government websites often end in .gov or .mil. Before sharing sensitive information, make sure you’re on a federal government site.
The site is secure. The https:// ensures that you are connecting to the official website and that any information you provide is encrypted and transmitted securely.
- Publications
- Account settings
Preview improvements coming to the PMC website in October 2024. Learn More or Try it out now .
- Advanced Search
- Journal List
- Patterns (N Y)
- v.2(3); 2021 Mar 12
Mapping research topics at multiple levels of detail
1 ICPSR, University of Michigan, Ann Arbor, MI 48109, USA
Werner Kuhn
2 Department of Geography, University of California, Santa Barbara, CA 93106, USA
Kelly Caylor
Libby hemphill, associated data.
The data and code supporting our analysis for the institutional review is available in our public Github repository: https://github.com/saralafia/ERI-5-year-review . More information about ERI's review process is available on its website: https://www.eri.ucsb.edu/2014-external-review .
The institutional review of interdisciplinary bodies of research lacks methods to systematically produce higher-level abstractions. Abstraction methods, like the “distant reading” of corpora, are increasingly important for knowledge discovery in the sciences and humanities. We demonstrate how abstraction methods complement the metrics on which research reviews currently rely. We model cross-disciplinary topics of research publications and projects emerging at multiple levels of detail in the context of an institutional review of the Earth Research Institute (ERI) at the University of California at Santa Barbara. From these, we design science maps that reveal the latent thematic structure of ERI's interdisciplinary research and enable reviewers to “read” a body of research at multiple levels of detail. We find that our approach provides decision support and reveals trends that strengthen the institutional review process by exposing regions of thematic expertise, distributions and clusters of work, and the evolution of these aspects.
- • A method for modeling and mapping topics from bibliometric data
- • A web application dashboard with interactive, multilevel topic maps
- • A user evaluation of topic mapping's utility in institutional reviews
The bigger picture
Research institutes and organizations are interested in communicating the impact of their work and its value to a broader audience. However, quantifying impact and providing high-level views of interdisciplinary research trends are challenging. To address this, we leverage distant reading methods from the digital humanities to model the topics of a large body of interdisciplinary research products and visualize them in maps. We analyze 3,770 academic publications and grants affiliated with an interdisciplinary earth science research institute over a 10-year period and model its research topics. We then map the topics at two distinct levels of detail and evaluate the interpretation of the maps through a survey of leading researchers. We show that the topic maps reveal insights including the emergence of interdisciplinary collaboration areas and evolving areas of expertise over time.
Many institutions use metrics to evaluate their research productivity; however, it is challenging to effectively summarize and evaluate research across academic disciplines. We use topic modeling to develop maps of science at multiple levels of detail. The maps were used in an institutional review and evaluated by leading researchers at an earth science institute. We demonstrate that mapping research topics supports the review process by offering insights into interdisciplinary research collaborations and areas of expertise at the institute.
Introduction
Universities and funding agencies request that organized research units (ORUs) summarize and report on their research, collaboration, and growth as part of periodic institutional reviews. These reviews typically ask questions about trends in research quality, significance, research specialties, areas of influence or prominence, and interdisciplinarity collaborations. The review process is not unique to universities or research institutes; many kinds of organizations, including those in non-governmental, governmental, and industry settings, regularly conduct “meta-research” 1 on their activities in order to provide a high-level view of their impact and productivity. Yet, it remains unclear how best to summarize and present interdisciplinary bodies of work in ways that generate useful insights and can support effective reviews.
Bibliometrics and scientometrics support the quantitative study of published documentation and academic disciplines; 2 they have become cornerstones of institutional research assessments. Research administrators and funding agencies often use metrics, like the Hirsch index (h-index) and the journal impact factor (JIF), to assess the impact and performance of departments or individual researchers and to monitor collaborators or competitors. 3 Such metrics are trusted due in part to their perceived scientific legitimacy and because they offer indicators, which, if appropriately selected and applied, can yield data to support performance monitoring and the selection of research priorities. 4
Quantitative metrics like impact factors, however, have been recognized as poor choices for assessing or comparing research output of scholars and journals. They are often not comparable across academic disciplines 5 and have been found to be vulnerable to manipulation. 6 A study of the relationship between journals and citation rates has demonstrated evidence of a cumulative advantage for publications in “high-impact” journals. 7 The single numbers these metrics produce also obscure differences between disciplines and outlets over time.
Alternative quantitative metrics have been developed in response to these limitations. The Eigenfactor metrics 8 consider author centrality in citation networks, while the SCImago index 9 considers the flow of prestige between thematically related journals. Altmetrics 10 capture a more comprehensive picture of the ecosystem of scientific products and activity, like discourse about scientific software, that goes beyond the partial view from formal citations. These metrics are reshaping how scientists value research products and assess impact. 11
In this vein, there is a growing desire for interdisciplinary research evaluation that can more adequately capture impact and quality. One strategy has been to complement quantitative metrics with high-level characterizations and narratives. 12 Another has been to develop maps that chart the structure of knowledge domains and show the development of research areas, their interconnections, and evolution within them. 13 These approaches offer more contextual information than single-measure quantitative metrics. Science maps are examples of spatializations, 14 which use space as a metaphor to map abstract domains to thematic spaces in which nearby elements are similar. They can help evaluators process more information 15 than can be effectively communicated by a single quantitative metric; they also make patterns and trends more apparent.
In this article, we examine the utility and benefits of spatialization to produce maps of research that support an institutional review, specifically by revealing trends and providing decision support. To develop and test our ideas, we situate our study in the context of an ORU at the University of California at Santa Barbara (UCSB): the Earth Research Institute (ERI) ( https://www.eri.ucsb.edu/ ). ERI's stated mission is to “support research and education in the sciences of the solid, fluid, and living Earth.” Core areas of research within the institute consist of natural hazards, human impacts, earth system science, and earth evolution. ERI's faculty and researchers are supported by 145 different funding agencies covering the full breadth of earth and environmental sciences.
To date, ERI has taken an ad hoc approach to characterizing its research. For example, anecdotal observations based on faculty hires from ERI's last institutional review indicated that its expertise had broadened from traditional earth science and crustal studies to include conservation and biodiversity topics. To formally capture and verify this kind of institutional knowledge about ERI's evolving research expertise, we propose a data-driven approach for eliciting cross-cutting research topics. Our approach demonstrates how science mapping can complement current quantitative or ad hoc approaches to institutional reviews by uncovering trends and relationships obscured by other metrics. We produced research maps that capture the latent thematic structure of an interdisciplinary body of research at multiple levels of detail. To do this, we analyzed research publications and funded projects from 240 researchers spanning 24 academic departments affiliated with ERI between 2009 and 2019. We then evaluated the insights that the maps can support by surveying researchers within the institution whose work is represented in the maps.
In the remainder of this article, we situate our work in relation to existing approaches for abstracting and mapping information. Specifically, we discuss science mapping as a method for domain analysis and knowledge representation. We then describe our approach to produce maps of a body of research at two levels of detail. Finally, we report how leading ERI researchers evaluate the potential for our maps to support an institutional review. A delay in the actual institutional review (resulting from COVID-19) precluded feedback from external reviewers in time for our research project. We find that our approach complements the review process by exposing and relating thematic expertise, highlighting relationships between academic departments or teams of authors, analyzing topical distributions and clusters of work, and tracking the evolution of these aspects over time.
The interpretation of interdisciplinary research trends and impact is an important task for many research institutions, and single-value quantitative metrics are insufficient. We review methods that facilitate trend and impact analysis by abstracting and visually summarizing large collections of research documents. To situate our contribution, we first review science mapping applications in scientometrics and knowledge domain visualizations. We then describe dimensionality reduction and data visualization techniques used to design science maps, namely topic modeling and clustering techniques.
Science mapping
Mapping is indispensable in many monitoring and planning contexts; without maps of the physical territory, it would be challenging to plan and manage the development of cities, landscapes, and infrastructure. Cadastral maps, for example, document ownership and other rights to the land; they also inform and communicate numerous planning interventions, including strategic land use decisions, economic investment, and mitigation measures. 16
Science mapping charts the structure and evolution of knowledge in a domain or discipline by using maps as visual communication metaphors. 13 Science maps are based on bodies of scientific literature analyzed using computational tools and visualized to highlight trends, which can be interpreted using theories of scientific change. 17 Scientometric applications use quantitative metrics, including author co-citation, 18 document or journal co-citation, 19 co-word analysis, 20 and other bibliometrics extracted from documents. Many applications configure bibliometric elements using multidimensional scaling, network analysis, tree maps, or other visualization techniques. 21 Similarity measures are constructed and applied along with dimensionality reduction to visualize scientific documents. 13
A number of recent applications combine topic modeling with interactive visualizations to provide decision support. A visual topic modeling system called UTOPIAN 22 combines several dimensionality reduction techniques, including topic modeling and clustering, to merge or split topics based on user input. A related system called Termite 23 presents salient terms discovered from each topic, which can be used to explore documents. Other systems for visualizing and interpreting topics include LDAvis, 24 TopicLens, 25 and VISTopic. 26 Like Termite, LDAvis supports interpretation of relevant relationships between terms and discovered topics; topics are presented in a low-dimensional view, showing their correspondence with terms. Like UTOPIAN, TopicLens responds dynamically to user input by regenerating multilevel topic models and embeddings based on user specifications. Similarly, VISTopic supports multilevel topic representation but partitions the corpus of input documents hierarchically.
Although our work bears similarities to these systems, we distinguish our contribution as follows. First, several of these existing systems allow users to adjust the level of detail in the visualizations, which is handled hierarchically. Strict hierarchies may not offer the best knowledge representation, however, especially in applications like institutional reviews where topical overlap is of interest. For example, a coarse representation of a corpus may have a topic about “ecology,” while a more detailed representation may have topics about “nutrient cycling” and “predation”; while related, these topics can also be independent of the more general “ecology” topic. Alternative tree-like structures, like semilattices or sets of partially overlapping concepts, might be more adequate for knowledge organization. 27 We chose not to take a hierarchical approach when modeling topics. Instead, we handle level of detail by selecting numbers of topics in advance.
Second, we chose not to exploit the potential of network visualizations based on quantitative metrics like co-citation. Network-based measures are well established 13 and support specific kinds of questions; in previous work, we found that embedding research objects based on their topical similarity revealed their distribution and the coverage of their corpus, while linking them revealed their topical connectivity and centrality. 28 As ERI is an interdisciplinary institution, however, we did not want to use metrics or create visual representations that would draw imbalanced comparisons between the contributions of individual researchers from different disciplines. Instead, we treat research documents as objects embedded in a continuous topic space, which form regions of research that change over time and vary by level of detail.
Finally, while many prior systems offer use cases with real data, few involve usability testing. We demonstrate the utility of our application, which is situated in a real institutional review. This allows us to collect valuable insights about science map interactions and interpretations as reported under Evaluation .
In the following sections, we focus on dimensionality reduction and data visualization techniques that underpin science mapping and support the exploration and discovery of research documents at multiple levels of detail.
Dimensionality reduction
Dimensionality reduction is a key step in producing science maps, as it addresses the problem of displaying complex, high-dimensional data in a low-dimensional space like a two-dimensional map. 13 This is analogous to cartographic generalization, where computational and cognitive issues of complexity are addressed by deliberately reducing the level of detail in the representation. 21 To reduce the level of detail in our corpus of research documents, we use topic modeling to identify major themes shared by research documents. Topic modeling offers a way to identify research topics latent in articles and projects that are not bounded by traditional silos, like academic departments and their terminologies.
Topic models are statistical machine learning techniques that can uncover structures in collections of documents, for example, by grouping documents in which similar terms co-occur. 29 Topic models have been applied to classify and summarize large collections of documents, as well as solving similarity judgment problems. 30 Topics themselves can also be of interest; for example, the National Institutes of Health and the National Science Foundation have developed topic-based search interfaces to explore trends across related research projects. 29
We consider two main kinds of topic modeling approaches: latent Dirichlet allocation (LDA) and non-negative matrix factorization (NMF). LDA represents documents as mixtures of topics composed of words with certain probabilities. 30 It assumes that similar words occur in similar contexts and aims to discover latent topics in the documents. LDA offers insights “into inter- or intra-document statistical structure” 30 and has been positioned as an improvement over other measures used in information-retrieval applications like term frequency-inverse document frequency, or tf-idf, 31 which is used to determine the relative importance of terms in a given document or corpus.
In matrix factorization approaches, a document-term matrix is decomposed into a smaller set of matrices, which can be interpreted as a topic model. 32 NMF is a dimensionality reduction technique for decomposing samples, which are documents in topic modeling. Similar to LDA, documents are represented as term vectors, which can be combined into a document term matrix. However, documents are represented as combinations of co-occurring terms rather than likelihoods. In NMF, term weighting using tf-idf, for example, 31 can also be used to boost distinctive terms.
A central challenge in topic modeling is the selection of an appropriate number of topics; selecting too few leads to overly broad topics, while selecting too many leads to redundancy. 33 Best practices recommend a combination of human evaluation strategies and topic coherence measures. 29 Coherence measures quantify the degree to which statements in a set support one another; in topic modeling, coherence measures evaluate sets of words that compose topics. 34
Data visualization
Data visualization controls the transformation and layout of data into a map. 13 To visualize research documents, we use clustering methods to further abstract the topic models and give a visual impression of their underlying structure, in particular, the similarity between concepts. Broadly, the outputs of these clustering methods can be interpreted as spatializations, which offer high-level views of content through the familiar visual modality of maps. 15
In general, space and time are fundamental ordering relations for knowledge representation. 35 The “spatial turn” observed in the social sciences and humanities has exploited the idea of spatial organization to facilitate cross-disciplinary exchange, allowing many lines of thought to converge. 36 In cognitive science, it has been claimed that conceptual spaces in which nearby concepts are similar underlie human thinking and learning. 37 The first law of cognitive geography, or distance-similarity metaphor, references the first law of geography, which states that “everything is related to everything else, but nearby things are more related than distant things.” 38 The distance-similarity metaphor treats distance in abstract spaces as metaphorically equivalent to dissimilarity. 39 These powers of spatial representation underpin the idea of spatialization, which maps abstract domains to spaces in which nearby elements are similar. 14 Spatialization has been applied to organize multidimensional and thematically diverse collections.
Previous studies have shown that levels of detail in spatialized displays, such as hierarchical regions, shape viewers' interpretation of the similarity of elements like news articles. 39 Spatialization relies on generalization methods for merging individual features into groups. This is analogous to cartographic generalization, which performs hierarchical clustering based on feature similarity and results in changing representations and labels for the features at each level of detail. 21
Spatialization methods are related to a broader suite of “macroscopic research” devices, 40 including science maps 13 and “distant reading” diagrams 41 that enable the study of patterns at multiple levels of detail over time. Distant reading, 41 in the digital humanities, provides methods for deliberately abstracting and visualizing text; to analyze hundreds of novels, for example, it is necessary to render fewer elements in order to offer a sharper sense of high-level themes and their interconnection. Distant reading uses graphs, maps, and trees to spatially configure units, like genres and novels, and reveal latent structures in their source material. These methods are generic enough to guide abstraction over many kinds of texts, which in our case are large numbers of abstracts from publications and grant proposals. They support a broader understanding of latent trends, such as the emergence and evolution of shared research topics.
To further systematize our spatialization methods, we apply the theory of core concepts of spatial information. 42 The concepts summarized in Table 1 provide a high-level vocabulary with which to ask and answer questions about phenomena in space and time. They capture distinct ways of computing with spatial information; thus, they are applicable to geographic as well as other kinds of spaces. They provide us with a set of interchangeable lenses through which research data can be spatialized and viewed. 43
Summary of core concepts of spatial information
To produce maps, we first produce a field of continuous topic values from the texts of research documents with a topic value at each position. This can be thought of as a landscape or surface of topic values. Research documents conceptualized as objects are then located in this continuous two-dimensional topic space according to their topic mixtures using two embedding techniques: t-distributed stochastic neighbor embedding, or t-SNE, 44 and uniform manifold approximation and projection, or UMAP. 45 Both t-SNE and UMAP model high-dimensional research objects as points in a low-dimensional map space while clustering similar objects and spacing apart dissimilar ones. This embedding results in regions of documents in which events , like changes in the configurations of individual or departmental research, can be detected over time.
We produce maps that support the distant reading of the ERI's activities at distinct levels of detail. These maps show research topics and their evolution over time. The input to these maps are the descriptions of two kinds of research documents: publications and funded projects. We take the titles and abstracts from their metadata and model topics from them at two distinct levels of detail. We then feed the resulting document topic models into spatialization algorithms to output maps of the research topics.
Data sources
We analyzed publications and funded projects from ERI's 240 researchers active from 2009 to 2019. We gathered publication metadata using the Dimensions API, which is available for non-commercial use. We retrieved publications for each active researcher at ERI during the study period. These publications were then hand-curated by ERI staff to verify that they were associated with the correct researcher and sponsored by ERI during the period of analysis. This yielded 3,108 publications. We retained the title, abstract, year, digital object identifier (DOI) (if available), and authors. Examples of publication outlets include PLOS One , Proceedings of the National Academy of Sciences , and Environmental Science & Technology . Field-of-research codes assigned to publications in Dimensions ( https://app.dimensions.ai/browse/categories/publication/for ) characterize major research areas and include earth sciences, biological sciences, environmental sciences, and engineering.
We also used ERI's internal data on funded proposals, grants, and contracts. Similarly, we retained only the title, abstract, year, and identifier (if available). This yielded 662 funded projects. The majority of funding for projects came from federal agencies like the National Science Foundation, National Aeronautics and Space Administration, and National Oceanic and Atmospheric Administration. Partnerships with municipal and state agencies along with other universities also provided substantial funding. Figure 1 summarizes the numbers of research publications and projects per year over the period of analysis.

Distribution of research documents per year for analysis period
Text pre-processing
We combined the metadata of the 3,770 research documents and performed text pre-processing by removing records with identical identifiers (DOIs or grant numbers), removing HTML tags, and reformatting ASCII extended characters. To determine whether to set a document length threshold, we checked the document distribution. Figure 2 shows a normal distribution of lengths, which are relatively concise; the average document is 1,678 characters long.

Distribution of research documents by word count
Next, we followed a standard natural language processing pipeline to reformat the titles and abstracts of the research documents. 46 We first determined distinct document terms using tf-idf. 31 This measure reflects the relative importance of a term to a document in a corpus and is often used as a weighting factor in information retrieval applications; we use this measure to balance specific terms that show up frequently in relatively few documents (e.g., “polymerase”) with those that show up frequently across many documents (e.g., “sample”). Many frequent terms describe research methods (e.g., “estimate”) rather than subject matter (e.g., “snow”).
We removed the following frequent and generic terms, which had low tf-idf scores: “data,” “study,” “project,” “research,” “collaborative,” “include,” “result,” “increase,” “high,” “low,” “large,” “include,” and “based.” We then constructed unigram and bigram models to preserve contiguous sequences of terms (e.g., “climate_change”). We did not lemmatize the input text because we did not want to lose the variation of domain-specific terms (e.g., “hydrology” and “hydrological”). We created a normalized document term matrix composed of 3,770 documents and 80,152 distinct terms. We set the minimum document frequency to 2 and we considered both unigrams and bigrams. This resulted in a corpus of documents and term frequencies to use in topic modeling.
Topic modeling
We applied LDA 30 and NMF 32 to the normalized document term matrix. Our goal was to model a range of topics for the documents and to generate coherent topics at multiple levels of detail that describe major research themes at ERI.
To determine a range of topic values to model, we used Miller's law 47 as a heuristic. It proposes that the average person can hold approximately 7 ± 2 “chunks” of information in working memory (e.g., 7 digits, 6 letters, 5 words), limiting the simultaneous perception and processing of information by humans. Miller's law, applied to our topic models, suggests a coarse level of detail (7 ± 2 topics) that reviewers should be able to consider at once. For a suitable number of topics at a more detailed level, we reapplied Miller's law to each chunk of the coarse level, resulting in bounds of (5 × 5) and (9 × 9), or a range of 25–81 chunks, or in our case topics, to generate.
To compare the models and evaluate their quality, we use coherence as an interpretability measure. It is based on the fundamental idea in classification that the members of a class should be more similar to one another than to members of other classes and measures the extent to which top terms representing a topic are semantically related, relative to other terms in the corpus. 48 Coherence is considered to be more human interpretable for evaluating topic model quality than other measures, including perplexity and log likelihood. 33 Specifically, we use the topic coherence Word2Vec metric, which generates word embeddings to evaluate the similarity of term level descriptors from topics. 49
We generated LDA and NMF models across a range of topic numbers (2–100) and calculated their coherence scores. Figure 3 shows a comparison between coherence scores for the LDA and NMF topic models. We generated LDA models using Gensim's Mallet wrapper ( https://radimrehurek.com/gensim/models/wrappers/ldamallet.html ) and NMF models using Scikit-learn ( https://scikit-learn.org/stable/modules/generated/sklearn.decomposition.NMF.html ). The NMF model was initialized with non-negative double-singular value decomposition (“nndsvd”), which is optimized for sparse data.

Coherence scores for NMF and LDA topic models with 2–100 topics
We found NMF to be a more suitable topic modeling approach for our purposes than LDA. It produced topic models with higher coherence scores than our LDA models by about 17% on average. This may be because NMF is better suited to modeling smaller or sparser datasets, like titles and abstracts, rather than full text. 50 We also found that NMF produced topics that were more indicative of subject matter, rather than methods. This may be due to term weighting with tf-idf, unlike LDA, which operates on raw term frequency. 33
Although the addition of topics increases the coherence of the models, we wanted to select models that followed the Miller's law heuristic we previously established; the NMF model with 100 topics has the highest coherence score, but this value is out of range. To select topic models, we relied on human evaluation 51 of the most coherent models within a first range of 5–9 topics and a second range of 25–81 topics. Specifically, ERI's director, Kelly Caylor, evaluated the topic descriptors for models within each range and selected two topic models to develop into maps: a coarse-grained model with 9 topics and a fine-grained model with 36 topics. This choice was important because we wanted to ensure that the themes emerging from the topic models were interpretable, in addition to being coherent, and could support institutional reporting.
Table 2 shows samples of topics and topic descriptors as a list of top terms for each of the NMF models we generated. Whereas most of the terms are unigrams, some bigrams, like “species_richness,” also capture scientific concepts that are compound terms. NMF results in a document-topic matrix in which each document is described by a mixture of topics with different strengths of association. The document-topic matrix forms the input to the subsequent spatializations, while the topic-term matrix is used to reference topics and term descriptors.
Topics and descriptors discovered for NMF topic models
Spatialization
The inputs to the spatializations are the document-topic matrices resulting from the coarse (9) and detailed (36) NMF topic models. We first mapped research documents with t-SNE using manifold learning in Scikit-learn ( https://scikit-learn.org/stable/modules/generated/sklearn.manifold.TSNE.html ). The t-SNE algorithm transforms the high-dimensional document-topic matrix into a low-dimensional coordinate representation. Each document is assigned a position based on its topic mixture, resulting in the placement of topically similar documents near one another and dissimilar documents farther apart. The UMAP process for assigning locations to research documents is similar to that of t-SNE; a key difference is the assumption that documents are uniformly distributed on a complex surface, resulting in a distinct spatial configuration. We produced these with UMAP learn ( https://umap-learn.readthedocs.io/en/latest/ ). The axes in both t-SNE and UMAP are left unlabeled, as they describe complex curved paths in the original high-dimensional space and do not have human-interpretable meaning. 44 , 45
We interactively explored the maps to interpret the effects of the map parameters, which balance local, pairwise similarity with global, intercluster similarity. 52 The first parameter influencing the size, distance, and shape of clusters is perplexity, which controls the number of nearest neighbors. Perplexity describes how well a probability distribution predicts a sample. In our maps, low perplexity values produce clearly delineated clusters, while high values allow for more global connectivity and less clearly delineated clusters. Typical values fall between 5 and 50 34 . The second parameter is early exaggeration, which determines the compactness of clusters. This optimization method creates empty space between clusters so they can achieve better global and local organization. 44
To select the map parameters, we used a visual inspection method. The director of ERI, Kelly Caylor, evaluated the topic regions resulting from the t-SNE and UMAP configurations against the benchmark of the previous institutional review report. Based on his familiarity with the institute's research, the director confirmed that the results from t-SNE with an early exaggeration value of 5 and a perplexity value of 7 were easiest to interpret and supported his reporting needs. Furthermore, Figure 4 shows that t-SNE produces local clusters of similar objects that are visually distinct, while UMAP allows for more outliers and preserves compact clusters; for instance, all red documents clustered and labeled with “fault (seismic motion)” are concentrated in UMAP, while they are split into three distinct regions in the t-SNE map. The effects of uniform spacing are also visible in UMAP; the red and blue clusters are disjoint in UMAP but are partial neighbors in t-SNE. The arrangement of individual documents and clusters of documents in t-SNE conveys topical similarity well. Based on these observations, the director deemed t-SNE to be a more compelling technique for reporting purposes.

ERI research documents clustered by 9 topics with t-SNE (left) and UMAP (right); each color corresponds to the document's main topic, labeled with three term descriptors
Our methods address the question of how to systematically elicit and represent the major topics of a complex, interdisciplinary body of research at multiple levels of detail that show their similarities and evolution over time. We produce maps of research documents located in a continuous topic space, which exhibit topical proximity in regions and capture multiple levels of detail over periods of time. We explore whether and how these maps of research topics support the institutional assessment of an interdisciplinary body of research.
Reading maps of research documents
The maps produced with t-SNE show research documents with similar topics forming regions at two distinct levels of detail. Documents are assigned to topic clusters, which are labeled with the first three terms from their topic descriptor. Topic modeling does not produce labels for the resulting topics, so assigning labels is a pragmatic choice that allows us to reference and interpret the topic clusters. The categorical colormap ( https://colorcet.holoviz.org/ ) offers perceptually distinct categories for visualizing the relatively large number of topics in the detailed topic model.
In the coarse map with 9 topics shown in Figure 5 , we observe patterns related to the centrality, size, contiguity, and proximity of clusters. Documents assigned to the large “ocean” cluster are in the center of the map, while smaller clusters like “snow” are on the periphery. This suggests that the documents described by the “ocean” topic are similar to more documents in the corpus than those assigned to the “snow” cluster, which may be more niche.

Coarse (9 topic) map of research documents (2009–2019)
The cluster labeled “rocks” is small and discrete compared with the “species” cluster, suggesting that more of ERI's research is ecological rather than geological in nature; however, these disciplinary identities are not mutually exclusive. Documents can be characterized by more than one research topic in the map.
Documents in the “soil moisture” cluster are uniformly located in a similar region of the map, while others, like those in the “climate change” cluster, are dispersed and non-contiguous. This suggests a lack of internal conformity within this cluster. Lower document dispersion in the “soil moisture” cluster suggests topical homogeneity, while higher dispersion in the “climate change” cluster suggests more heterogeneous documents.
The adjacency of the “sediment” cluster with the “rocks,” “climate change,” and “ocean” clusters suggests that its documents straddle, and sometimes bridge, these research areas, particularly those on the clusters' edges. Clusters located farther apart are also dissimilar. The “snow” and the “soil moisture” clusters are found on opposite sides of the map; however, other documents described by these topics are neighboring at the bottom of the map, converging around an edge of the “climate change” cluster. Indeed, the documents found there bridge these areas; they address snowmelt, surface temperature in forests, biomass accumulation, streamflow changes, and other related ideas.
Whereas the coarse map presents a distant overview of ERI's research topics, the detailed map shown in Figure 6 reveals intricate patterns. The center “population” cluster borders other research areas, including the “species,” “ocean,” and “fisheries” clusters. Another multitopic cluster found at the bottom map periphery gathers similar public policy research from different topics, like mitigating climate change impacts on fisheries and earth system science in Canada.

Detailed (36 topic) map of research documents (2009–2019)
The detailed map is made up of relatively even distributions of topic clusters. One exception is the “fecal” cluster on the right edge of the map, which is small and separated; its nearest neighbor is the “lakes” cluster below it. A larger “nanoparticles” cluster at the top of the map is associated with ERI's productive Center for Environmental Implications of Nanotechnology.
Central clusters tend to be less uniform than those at the edges. The “water,” “conservation,” and “methane” topic clusters are interspersed with documents addressing marine isotopes, stream mapping at a battlefield conservation site, and stream nitrate concentrations in mountainous watersheds. This is contrasted with the homogeneous clusters found at the edges, such as the “ice” cluster on the left edge dominated by documents addressing glaciers.
In the detailed map, we see that there are distinct, yet adjacent, areas of research involving similar researchers and shared ideas, such as integrating wildfire risk with the study of agricultural encroachment. The “conservation” and “fire” clusters are adjacent in the detailed map; in the coarse map, these documents fall under the “climate change” topic. In the detailed map, most “fire” research documents border the “sediment” and “fisheries” clusters, suggesting that documents about wildfire recovery and river restoration share similarities.
We have presented maps at two selected levels of detail: coarse (9 topics) and detailed (36 topics). The maps are systematically produced with the goal of improving upon the ad hoc definition and interpretation of research thrusts in the institutional review process. “Reading” these data-driven maps generates qualitative insights, as they represent topics extracted from the text of research documents. The maps also possess emergent qualities, revealing more than the sum of their parts; 41 they show patterns in ERI's research that were previously difficult or impossible to see when inspecting single documents, publication and project lists, or the work of individual researchers.
Deploying a map dashboard
To distribute and evaluate our maps, we deploy a public-facing dashboard ( https://eri-research-dashboard.herokuapp.com/ ) using Plotly, Dash for Python, and Heroku. The dashboard's “About” panel describes the map and allows users to select a level of detail, topics to map, and a year range. Figure 7 shows the “Search” panel, which allows users to filter data by ERI researcher or by academic department and return metadata for a selected document, including its DOI when available. We make time explicit by showing a map snapshot for each year, which can be filtered by a range of years. This provides a backdrop for the interpretation of events, such as the acquisition of major grants or the hiring of new faculty in growing research areas. We provide evidence supporting these interpretations in the next section, Evaluation .

Search panel of the interactive research map dashboard
Do the maps we developed support “distant reading of research documents in the context of an institutional review”? To answer this question, we evaluate the maps in two main ways. First, we use the maps to interpret and answer standard questions asked in the institutional review process. Second, we evaluate the maps in action, considering how they are used by the researchers whose work is being assessed. 53 We surveyed leading ERI researchers who determined if and how they think the maps support “reading at a distance.”
Institutional review questions
How do maps of research topics support questions commonly posed to reviewers? Here, we consider the six institutional review questions about research accomplishment that UCSB's ORUs must regularly address ( https://www.research.ucsb.edu/organized-research-unit-oru-administration ). They are currently answered using quantitative evidence, for example, numbers of publications by field of research and amounts of funding per researcher. Although these benchmark questions are particular to UCSB, the concerns they address are representative of similar contexts elsewhere:
- • Research quality and significance: describe the quality and significance of the research accomplished and in progress.
- • Trends and research specialties: comment on significant trends within the disciplines represented in the unit and relate these to current research specialties in your ORU.
- • Benefits to campus and departments: comment on how the ORU benefits the campus in general and academic departments in particular.
- • Participant productivity, influence, and prominence: comment on the continuing productivity and influence of unit participants, locally as well as nationally. Comment on evidence of prominence in the fields represented in the ORU.
- • Collaborations and interdisciplinarity: comment on the unit's collaborative/interdisciplinary work, its quality, and its impact on ORU research efforts and the campus.
- • Extramural funding: describe the possible sources and availability of extramural funds to support the unit's research. Are your participants sufficiently active in the pursuit of extramural funds in light of funding possibilities? How does the extent of annual extramural research funding compare with similar units nationwide?
We have claimed that maps of research topics can complement current evaluation metrics by supporting qualitative narratives. Here, we show how each of these questions can be addressed with maps of research topics:
Research quality and significance
JIFs are a typical quantitative metric. Our maps complement this by generating a broader picture of cross-disciplinary topics from research publications. They highlight researchers' and departments' main topics and topical reach (diffuse or tightly clustered). Researchers in the Bren School of Environmental Science and Management are represented across all major topics, while those affiliated with biology concentrate mainly in the “species” and “oceans” topic clusters.
Trends and research specialties
Funding agency priorities (e.g., NSF's “10 big ideas”) and publisher classification schemes (e.g., fields of research) are typical sources of evidence. Our maps define research topics emerging from publications and projects that are not constrained by external classification schemes or historic disciplinary boundaries. The detailed map captures the topical diversity of research across affiliations, while the coarse map emphasizes earth and environmental science topics unifying ERI's researchers.
Benefits to campus and departments
Evidence includes faculty recruitment, research computing infrastructure, and educational outreach programs. Temporal sequencing in our maps can be used to assess the impact of events, like the inception of educational programs (e.g., the Kids in Nature Program in 2012) or influential funding (e.g., a 2017 NSF award to upgrade campus computing resources). Although causality cannot be determined, it is interesting to note growth in certain topic areas following these events (e.g., a rise in ecological restoration projects following the start of educational programming and community outreach). These insights provide concrete and solid support over anecdotal discussions in institutional reviews.
Participant productivity, influence, and prominence
The professional accolades of individual participants, such as awards, are often reported as evidence. Our maps provide a more objective picture of the topics that each researcher addresses by showing the topical distribution of each researcher's documents. For example, geographer David Siegel's work is concentrated mainly in the “ocean” and “species” topic clusters, while geographer Dar Roberts's work is more broadly dispersed across “species,” “climate,” “ocean,” “snow,” “sediment,” and “soil moisture.” Although both accomplished researchers work extensively with remotely sensed imagery, differentiating their areas of expertise supports institutional management and reporting.
Collaborations and interdisciplinarity
The affiliations of collaborators on funded projects are typically offered as evidence of interdisciplinarity. Our maps currently annotate each project by a single researcher and do not emphasize projects that have collaborators from multiple departments. This functionality could be added if ERI's leadership were interested to see who drives collaborations, not just what common topics they address.
Extramural funding
This is currently based on award amounts. Our maps do not incorporate this kind of information because existing indicators are effective. The projects currently shown in the map have all been funded, but it could be valuable to also show the topics of unfunded projects, for example, to reveal changes to topics prioritized over time by funding agencies.
Researcher survey
How do ERI's leading researchers interpret their own role in ERI's evolving research? We seek to understand researchers' interpretations of topics and relationships shown in the maps. To gather feedback, we administered an online survey to researchers on ERI's advisory board. This survey also served as a rehearsal and internal review for the imminent 5-year review in which the primary map users will be external reviewers in leadership positions at similar institutes. The survey was kept intentionally short and contained the following items:
- • ERI topics: take a minute to explore the first map, at both the coarse and the fine levels of detail. How well do you think these topics represent ERI's research overall?
- • Principal investigator (PI) topics: next, find yourself in the Search panel. Your publications or projects will be highlighted. How well do you think this map represents your research?
- • Topic evolution: finally, try filtering the research documents using the time slider. Do you notice any trends, and do these coincide with any events in ERI's history that you can recall?
- • Other: do you have any other comments or ideas for improving this tool?
We received responses from 5/13 members of the ERI advisory board. The main ideas that emerged from the responses can be separated into observations made from the maps and comments about map design. These responses provide suggestive evidence, which is summarized as follows:
A majority (3/5) of respondents felt that the coarse map adequately described ERI's research, while the remainder had some objections. One noted that the coarse map “lacks several important categories (e.g., biogeochemistry, inland waters, carbon cycle)” but that “the detailed map represents the range of research.” Another felt that the topics reduced all of ERI's research to “physical entities” that made it seem like a geology department. These concerns may relate to the design decision to label and color the documents by main topics; the labels include the first term from the topic descriptor with the second and third included in parentheses. Because topic modeling does not produce labels for the resulting topics, any succinct labeling in support of readability and verbalization skews the presentation. This feedback suggests that alternative approaches to labeling the topics could help because the objections raised were related to category names rather than the clustering of documents.
Researcher topics
Respondents (3/5) felt that they understood the positions of their documents relative to ERI's research landscape. Several mentioned that their “assignments” aligned with their identities as researchers; one noted “I was largely in the species topic group and I do identify as a species-based researcher.” Another felt that their work was categorized “imperfectly at best” as they work mainly on carbon cycling but had been associated with soils. These observations raise interesting challenges for visualizing perceived differences between researchers' self-assigned specialties and positions assigned to their work based on a relatively short period of time.
Topic evolution
One researcher stated that trends in the map pointed to the founding of the UC Center for Environmental Implications of Nanotechnology at UCSB in 2013. Another noted that the map “appears to start out along the edges then fills in the middle … maybe it is selective hiring of people to bridge gaps?” These interpretations speak to the utility of the spatialization approach; researchers are able to associate patterns in the map with probable events in which interdisciplinary research topics emerge, bridging traditional clusters. Changes in topical “coverage” following a faculty hire or large funding awards were observable to the respondents when they used the maps in combination with the time slider. Their observations demonstrate the kinds of insights that we envisioned the temporally sequenced maps might offer.
Most of the comments about map functionality address click interactions, background color, alphabetization of lists, and other details that are easily changed. Suggestions for additional functionality included ways to browse lists of related documents based on shared topics, to “visualize closely linked topics,” and to search based on grants and papers. We expect to incorporate respondents' suggestions in preparation for the upcoming institutional review. We take the leading researchers' responses as a qualified endorsement of the generalization and visual presentation of work done at their institute.
We applied science mapping, dimensionality reduction, and visualization techniques to uncover research relationships and temporal trends in a corpus of research documents. To confirm the utility of this approach, we surveyed researchers represented within the maps. Our research has immediate benefits for ERI as they prepare for their external review. It facilitates ERI's efforts to identify research trends and areas of expertise, determine the impact of various investments on ERI's productivity, and differentiate scholars' unique areas of contribution. Similar systems would be useful for other research enterprises and funders interested in understanding their own trends and productivity.
One limitation of our approach is that it primarily takes advantage of the thematic dimension of data and treats the spatial and temporal components of the data as secondary. Although temporal views are incorporated in our maps, allowing for document subsetting by time span and event detection, making time a primary dimension could prove valuable. Previous work on semantic signatures has shown that time and space offer two complementary ways to order knowledge. 35 Views ordered primarily by time could be thought of as temporalizations, rather than the spatializations we develop, tracking the evolution of topics in the form of graphs from distant reading. 41
Another limitation is that our approach does not take advantage of all of the core concepts of spatial information presented in Table 1 . This interpretation suggests technical ways in which our work can be extended. Currently, we embed research documents ( objects ) in a continuous topic space ( field ), which forms regions of research topics. The number of research topics selected ( granularity ) influences the configurations of the topic regions; in our maps, these configurations (detailed and coarse) are independent and are not linked. Time is also handled as a series of annual snapshots over a decade, where change is depicted as the reconfiguration of topic regions between these intervals ( event ).
First, adopting additional topic modeling approaches, such as hierarchical 54 and dynamic topic models, 55 would account for multiple levels of thematic and temporal detail within a single model rather than producing separate models at different levels of detail. Second, adopting other visualization methods to depict network information from the documents 17 would convey additional relationships holding among the documents, such as co-authorship or funding patterns. Future modeling and visualization choices should be guided by the priorities of the institute in order to ensure they support the review process.
In terms of evaluation, we are also interested in expanding the survey we conducted to coincide with ERI's external review. This would give us further insights into how external reviewers who do not have a personal connection to ERI's research interpret and evaluate the research topics. To determine the applicability and maturity of our approach for adoption in a broader context, we would also be interested in surveying researchers or leaders affiliated with similar ORUs. This would allow us to build consensus around strategies for adopting maps of research as robust decision support tools.
At the outset of this article, we proposed that maps of the research “territory” could provide actionable decision support. The maps we have produced give an impression of the underlying thematic structure of the research in the form of research regions that are meaningful within, and possibly across, institutions. Just as land use maps are used to manage resources and forecast growth in a regional planning context, maps of research can be used to do the same in an institutional setting. We envision maps of research topics being used internally as part of the ORU's self-assessment and externally as a communication tool describing research trends and developments, which are likely of interest to external reviewers, other research units, and the public.
Experimental procedures
Resource availability, lead contact.
Sara Lafia is the lead contact of this study and can be reached at [email protected] .
Materials availability
The code developed for the topic models and data visualizations reported in this article are available in our public Github repository: https://github.com/saralafia/ERI-maps . The code developed for the reporting dashboard is available in our public Github repository: https://github.com/saralafia/ERI-dashboard .
Data and code availability
Acknowledgments.
We thank the members of ERI's advisory board, along with Daniel R. Montello and James Frew at UCSB, for supporting and guiding this study. We also acknowledge support from an anonymous private grant ( http://spatial.ucsb.edu/research/spatial-discovery ) awarded to the UCSB Center for Spatial Studies and UCSB Library to study challenges and strategies that libraries and researchers face when trying to discover research data on diverse platforms. This material is based upon work supported by the National Science Foundation under grant 1930645.
Author contributions
Conceptualization, S.L., W.K., and K.C.; methodology, S.L.; data curation, S.L. and K.C.; writing – original draft, S.L., W.K., and K.C.; writing – review & editing, S.L. and L.H.; visualization, S.L.; supervision, W.K. and L.H.; funding acquisition, K.C. and L.H.
Declaration of interests
The authors declare no competing interests.
Published: February 15, 2021
Choose Your Test
Sat / act prep online guides and tips, 113 great research paper topics.
General Education

One of the hardest parts of writing a research paper can be just finding a good topic to write about. Fortunately we've done the hard work for you and have compiled a list of 113 interesting research paper topics. They've been organized into ten categories and cover a wide range of subjects so you can easily find the best topic for you.
In addition to the list of good research topics, we've included advice on what makes a good research paper topic and how you can use your topic to start writing a great paper.
What Makes a Good Research Paper Topic?
Not all research paper topics are created equal, and you want to make sure you choose a great topic before you start writing. Below are the three most important factors to consider to make sure you choose the best research paper topics.
#1: It's Something You're Interested In
A paper is always easier to write if you're interested in the topic, and you'll be more motivated to do in-depth research and write a paper that really covers the entire subject. Even if a certain research paper topic is getting a lot of buzz right now or other people seem interested in writing about it, don't feel tempted to make it your topic unless you genuinely have some sort of interest in it as well.
#2: There's Enough Information to Write a Paper
Even if you come up with the absolute best research paper topic and you're so excited to write about it, you won't be able to produce a good paper if there isn't enough research about the topic. This can happen for very specific or specialized topics, as well as topics that are too new to have enough research done on them at the moment. Easy research paper topics will always be topics with enough information to write a full-length paper.
Trying to write a research paper on a topic that doesn't have much research on it is incredibly hard, so before you decide on a topic, do a bit of preliminary searching and make sure you'll have all the information you need to write your paper.
#3: It Fits Your Teacher's Guidelines
Don't get so carried away looking at lists of research paper topics that you forget any requirements or restrictions your teacher may have put on research topic ideas. If you're writing a research paper on a health-related topic, deciding to write about the impact of rap on the music scene probably won't be allowed, but there may be some sort of leeway. For example, if you're really interested in current events but your teacher wants you to write a research paper on a history topic, you may be able to choose a topic that fits both categories, like exploring the relationship between the US and North Korea. No matter what, always get your research paper topic approved by your teacher first before you begin writing.
113 Good Research Paper Topics
Below are 113 good research topics to help you get you started on your paper. We've organized them into ten categories to make it easier to find the type of research paper topics you're looking for.
Arts/Culture
- Discuss the main differences in art from the Italian Renaissance and the Northern Renaissance .
- Analyze the impact a famous artist had on the world.
- How is sexism portrayed in different types of media (music, film, video games, etc.)? Has the amount/type of sexism changed over the years?
- How has the music of slaves brought over from Africa shaped modern American music?
- How has rap music evolved in the past decade?
- How has the portrayal of minorities in the media changed?

Current Events
- What have been the impacts of China's one child policy?
- How have the goals of feminists changed over the decades?
- How has the Trump presidency changed international relations?
- Analyze the history of the relationship between the United States and North Korea.
- What factors contributed to the current decline in the rate of unemployment?
- What have been the impacts of states which have increased their minimum wage?
- How do US immigration laws compare to immigration laws of other countries?
- How have the US's immigration laws changed in the past few years/decades?
- How has the Black Lives Matter movement affected discussions and view about racism in the US?
- What impact has the Affordable Care Act had on healthcare in the US?
- What factors contributed to the UK deciding to leave the EU (Brexit)?
- What factors contributed to China becoming an economic power?
- Discuss the history of Bitcoin or other cryptocurrencies (some of which tokenize the S&P 500 Index on the blockchain) .
- Do students in schools that eliminate grades do better in college and their careers?
- Do students from wealthier backgrounds score higher on standardized tests?
- Do students who receive free meals at school get higher grades compared to when they weren't receiving a free meal?
- Do students who attend charter schools score higher on standardized tests than students in public schools?
- Do students learn better in same-sex classrooms?
- How does giving each student access to an iPad or laptop affect their studies?
- What are the benefits and drawbacks of the Montessori Method ?
- Do children who attend preschool do better in school later on?
- What was the impact of the No Child Left Behind act?
- How does the US education system compare to education systems in other countries?
- What impact does mandatory physical education classes have on students' health?
- Which methods are most effective at reducing bullying in schools?
- Do homeschoolers who attend college do as well as students who attended traditional schools?
- Does offering tenure increase or decrease quality of teaching?
- How does college debt affect future life choices of students?
- Should graduate students be able to form unions?

- What are different ways to lower gun-related deaths in the US?
- How and why have divorce rates changed over time?
- Is affirmative action still necessary in education and/or the workplace?
- Should physician-assisted suicide be legal?
- How has stem cell research impacted the medical field?
- How can human trafficking be reduced in the United States/world?
- Should people be able to donate organs in exchange for money?
- Which types of juvenile punishment have proven most effective at preventing future crimes?
- Has the increase in US airport security made passengers safer?
- Analyze the immigration policies of certain countries and how they are similar and different from one another.
- Several states have legalized recreational marijuana. What positive and negative impacts have they experienced as a result?
- Do tariffs increase the number of domestic jobs?
- Which prison reforms have proven most effective?
- Should governments be able to censor certain information on the internet?
- Which methods/programs have been most effective at reducing teen pregnancy?
- What are the benefits and drawbacks of the Keto diet?
- How effective are different exercise regimes for losing weight and maintaining weight loss?
- How do the healthcare plans of various countries differ from each other?
- What are the most effective ways to treat depression ?
- What are the pros and cons of genetically modified foods?
- Which methods are most effective for improving memory?
- What can be done to lower healthcare costs in the US?
- What factors contributed to the current opioid crisis?
- Analyze the history and impact of the HIV/AIDS epidemic .
- Are low-carbohydrate or low-fat diets more effective for weight loss?
- How much exercise should the average adult be getting each week?
- Which methods are most effective to get parents to vaccinate their children?
- What are the pros and cons of clean needle programs?
- How does stress affect the body?
- Discuss the history of the conflict between Israel and the Palestinians.
- What were the causes and effects of the Salem Witch Trials?
- Who was responsible for the Iran-Contra situation?
- How has New Orleans and the government's response to natural disasters changed since Hurricane Katrina?
- What events led to the fall of the Roman Empire?
- What were the impacts of British rule in India ?
- Was the atomic bombing of Hiroshima and Nagasaki necessary?
- What were the successes and failures of the women's suffrage movement in the United States?
- What were the causes of the Civil War?
- How did Abraham Lincoln's assassination impact the country and reconstruction after the Civil War?
- Which factors contributed to the colonies winning the American Revolution?
- What caused Hitler's rise to power?
- Discuss how a specific invention impacted history.
- What led to Cleopatra's fall as ruler of Egypt?
- How has Japan changed and evolved over the centuries?
- What were the causes of the Rwandan genocide ?

- Why did Martin Luther decide to split with the Catholic Church?
- Analyze the history and impact of a well-known cult (Jonestown, Manson family, etc.)
- How did the sexual abuse scandal impact how people view the Catholic Church?
- How has the Catholic church's power changed over the past decades/centuries?
- What are the causes behind the rise in atheism/ agnosticism in the United States?
- What were the influences in Siddhartha's life resulted in him becoming the Buddha?
- How has media portrayal of Islam/Muslims changed since September 11th?
Science/Environment
- How has the earth's climate changed in the past few decades?
- How has the use and elimination of DDT affected bird populations in the US?
- Analyze how the number and severity of natural disasters have increased in the past few decades.
- Analyze deforestation rates in a certain area or globally over a period of time.
- How have past oil spills changed regulations and cleanup methods?
- How has the Flint water crisis changed water regulation safety?
- What are the pros and cons of fracking?
- What impact has the Paris Climate Agreement had so far?
- What have NASA's biggest successes and failures been?
- How can we improve access to clean water around the world?
- Does ecotourism actually have a positive impact on the environment?
- Should the US rely on nuclear energy more?
- What can be done to save amphibian species currently at risk of extinction?
- What impact has climate change had on coral reefs?
- How are black holes created?
- Are teens who spend more time on social media more likely to suffer anxiety and/or depression?
- How will the loss of net neutrality affect internet users?
- Analyze the history and progress of self-driving vehicles.
- How has the use of drones changed surveillance and warfare methods?
- Has social media made people more or less connected?
- What progress has currently been made with artificial intelligence ?
- Do smartphones increase or decrease workplace productivity?
- What are the most effective ways to use technology in the classroom?
- How is Google search affecting our intelligence?
- When is the best age for a child to begin owning a smartphone?
- Has frequent texting reduced teen literacy rates?

How to Write a Great Research Paper
Even great research paper topics won't give you a great research paper if you don't hone your topic before and during the writing process. Follow these three tips to turn good research paper topics into great papers.
#1: Figure Out Your Thesis Early
Before you start writing a single word of your paper, you first need to know what your thesis will be. Your thesis is a statement that explains what you intend to prove/show in your paper. Every sentence in your research paper will relate back to your thesis, so you don't want to start writing without it!
As some examples, if you're writing a research paper on if students learn better in same-sex classrooms, your thesis might be "Research has shown that elementary-age students in same-sex classrooms score higher on standardized tests and report feeling more comfortable in the classroom."
If you're writing a paper on the causes of the Civil War, your thesis might be "While the dispute between the North and South over slavery is the most well-known cause of the Civil War, other key causes include differences in the economies of the North and South, states' rights, and territorial expansion."
#2: Back Every Statement Up With Research
Remember, this is a research paper you're writing, so you'll need to use lots of research to make your points. Every statement you give must be backed up with research, properly cited the way your teacher requested. You're allowed to include opinions of your own, but they must also be supported by the research you give.
#3: Do Your Research Before You Begin Writing
You don't want to start writing your research paper and then learn that there isn't enough research to back up the points you're making, or, even worse, that the research contradicts the points you're trying to make!
Get most of your research on your good research topics done before you begin writing. Then use the research you've collected to create a rough outline of what your paper will cover and the key points you're going to make. This will help keep your paper clear and organized, and it'll ensure you have enough research to produce a strong paper.
What's Next?
Are you also learning about dynamic equilibrium in your science class? We break this sometimes tricky concept down so it's easy to understand in our complete guide to dynamic equilibrium .
Thinking about becoming a nurse practitioner? Nurse practitioners have one of the fastest growing careers in the country, and we have all the information you need to know about what to expect from nurse practitioner school .
Want to know the fastest and easiest ways to convert between Fahrenheit and Celsius? We've got you covered! Check out our guide to the best ways to convert Celsius to Fahrenheit (or vice versa).
These recommendations are based solely on our knowledge and experience. If you purchase an item through one of our links, PrepScholar may receive a commission.

Christine graduated from Michigan State University with degrees in Environmental Biology and Geography and received her Master's from Duke University. In high school she scored in the 99th percentile on the SAT and was named a National Merit Finalist. She has taught English and biology in several countries.
Student and Parent Forum
Our new student and parent forum, at ExpertHub.PrepScholar.com , allow you to interact with your peers and the PrepScholar staff. See how other students and parents are navigating high school, college, and the college admissions process. Ask questions; get answers.

Ask a Question Below
Have any questions about this article or other topics? Ask below and we'll reply!
Improve With Our Famous Guides
- For All Students
The 5 Strategies You Must Be Using to Improve 160+ SAT Points
How to Get a Perfect 1600, by a Perfect Scorer
Series: How to Get 800 on Each SAT Section:
Score 800 on SAT Math
Score 800 on SAT Reading
Score 800 on SAT Writing
Series: How to Get to 600 on Each SAT Section:
Score 600 on SAT Math
Score 600 on SAT Reading
Score 600 on SAT Writing
Free Complete Official SAT Practice Tests
What SAT Target Score Should You Be Aiming For?
15 Strategies to Improve Your SAT Essay
The 5 Strategies You Must Be Using to Improve 4+ ACT Points
How to Get a Perfect 36 ACT, by a Perfect Scorer
Series: How to Get 36 on Each ACT Section:
36 on ACT English
36 on ACT Math
36 on ACT Reading
36 on ACT Science
Series: How to Get to 24 on Each ACT Section:
24 on ACT English
24 on ACT Math
24 on ACT Reading
24 on ACT Science
What ACT target score should you be aiming for?
ACT Vocabulary You Must Know
ACT Writing: 15 Tips to Raise Your Essay Score
How to Get Into Harvard and the Ivy League
How to Get a Perfect 4.0 GPA
How to Write an Amazing College Essay
What Exactly Are Colleges Looking For?
Is the ACT easier than the SAT? A Comprehensive Guide
Should you retake your SAT or ACT?
When should you take the SAT or ACT?
Stay Informed
Get the latest articles and test prep tips!
Looking for Graduate School Test Prep?
Check out our top-rated graduate blogs here:
GRE Online Prep Blog
GMAT Online Prep Blog
TOEFL Online Prep Blog
Holly R. "I am absolutely overjoyed and cannot thank you enough for helping me!”
A decade of aphantasia research: what we've learned about people who can't visualize
People who can't visualise an image in their mind's eye are less likely to remember the details of important past personal events or to recognise faces, according to a review of nearly ten years of research.
People who cannot bring to mind visual imagery are also less likely to experience imagery of other kinds, like imagining music, according to new research by the academic who first discovered the phenomenon.
Professor Adam Zeman, of the University of Exeter, first coined the term aphantasia in 2015, to describe those who can't visualise. Since then, tens of thousands of people worldwide have identified with the description. Many say they knew they processed information differently to others but were unable to describe how. Some of them expressed shock on discovering that other people can conjure up an image in their mind's eye.
Now, Professor Zeman has conducted a review of around 50 recent studies, published in Trends in Cognitive Sciences , to summarise findings in a field that has emerged since his first publication. Research indicates that aphantasia is not a single entity but has subtypes. For example, not everyone with aphantasia has a poor autobiographical memory or difficulty in recognising faces, and in a minority of people, aphantasia appeared to be linked to autism. People who cannot visualise are more likely to have scientific occupations. Unexpectedly, although people with aphantasia can't visualise at will, they often dream visually.
Professor Zeman's review provides evidence that whether people have aphantasia or hyperphantasia -- a particularly vivid visual imagination -- is linked to variations in their physiology and neural connectivity in the brain, as well as in behaviour. For example, listening to scary stories alters skin conductance in those with imagery, meaning people sweat -- but this does not occur in people with aphantasia.
Aphantasia is thought to affect around one per cent of the population, while three per cent are hyperphantasic. These figures rise to around five and 10 per cent with more generous criteria for inclusion. Both aphantasia and hyperphantasia often run in families, hinting at the possibility of a genetic basis.
Professor Zeman, who now holds honorary contracts at the universities of Exeter and Edinburgh, said: "Coining the term 'aphantasia' has unexpectedly opened a window on a neglected aspect of human experience. It is very gratifying that people who lack imagery have found the term helpful, while a substantial surge of research is shedding light on the implications of aphantasia.
"Despite the profound contrast in subjective experience between aphantasia and hyperphantasia, effects on everyday functioning are subtle -- lack of imagery does not imply lack of imagination. Indeed, the consensus among researchers is that neither aphantasia nor hyperphantasia is a disorder. These are variations in human experience with roughly balanced advantages and disadvantages. Further work should help to spell these out in greater detail."
The paper is entitled 'Aphantasia and hyperphantasia -- exploring imagery vividness extremes', and is published in Trends in Cognitive Sciences.
"I struggle to fully immerse myself in role-play with my children"
Solicitor Mary Wathen's frustration that she struggled to engage in role playing games with her two young children, when she found all other engagement with her children so fulfilling, was her sign that she had aphantasia, meaning she cannot visualise imagery.
The 43-year-old, from Newent near Cheltenham, said: "One of my friends said that he uses the images in his head to enhance role play. When I asked him to explain this in more detail it became clear that he -- and everyone else in the room -- could easily create an image in their head and use that as the backdrop for the role play. This was totally mind-blowing to me. I just cannot understand what they really mean -- where is this image and what does it look like? To me, unless you can see something with your eyes, it's not there."
Mary's shock intensified when she realised her husband, has such vivid visual imagery that he is probably hyperphantasic. "He thinks in moving pictures, like movies -- sometimes to the point that he can mistake those thoughts for memories. To me, that's unfathomable."
Mary has come to realise that her lack of visual imagery may well account for her difficulties with memory. She said: "I can comprehend and retain concepts and principles really well but I'm unable to recall facts and figures. I can't recreate something in my head or 're see' something that is not actually there in that moment.
"I've found it quite saddening to learn that other people can call to mind an image of their children when they're not there. I'd love to be able to do that, but I just can't -- but I've learned to compensate by taking plenty of photos, so that I can relive those memories through those images.
"Whilst I'm sure there are wonderful advantages to being able to think in pictures, I think it's important to remind myself that there are advantages to having aphantasia too. I'm a really good written and verbal communicator -- I think that's because I'm not caught up with any pictures, so I just focus on the power of the word. I'm also a deeply emotional person and perhaps that's my brain's way of overcompensating; I feel things as a way of experiencing them, rather than seeing them.
"I think it's really important to raise awareness that some people just don't have this ability -- particularly as using visual imagination is a key way that young children are taught to learn and engage. Primary teachers need to know that some children just won't be able to visualise and that could be why they're not engaging in those kinds of activities. We need to ensure we cater for everyone and encourage other ways of learning and engaging."
- Child Development
- Language Acquisition
- Intelligence
- Learning Disorders
- Educational Psychology
- Philosophy of mind
- Visual perception
- Social cognition
- Psychedelic drug
- Illusion of control
- Double blind
Story Source:
Materials provided by University of Exeter . Original written by Louise Vennells. Note: Content may be edited for style and length.
Journal Reference :
- Adam Zeman. Aphantasia and hyperphantasia: exploring imagery vividness extremes . Trends in Cognitive Sciences , 2024; DOI: 10.1016/j.tics.2024.02.007
Cite This Page :
Explore More
- Extremely Fast Wound Healing: New Treatment
- Micro-Lisa! Novel Nano-Scale Laser Writing
- Simple Brain-Computer Link: Gaming With Thoughts
- Clinical Reasoning: Chatbot Vs Physicians
- Understanding People Who Can't Visualize
- Illuminating Oxygen's Journey in the Brain
- DNA Study IDs Descendants of George Washington
- Heart Disease Risk: More Than One Drink a Day
- Unlocking Supernova Stardust Secrets
- Why Do Some Memories Become Longterm?
Trending Topics
Strange & offbeat.
- SUGGESTED TOPICS
- The Magazine
- Newsletters
- Managing Yourself
- Managing Teams
- Work-life Balance
- The Big Idea
- Data & Visuals
- Reading Lists
- Case Selections
- HBR Learning
- Topic Feeds
- Account Settings
- Email Preferences
Research: Leaders Undervalue Creative Work from AI-Managed Teams
- Shane Schweitzer
- David De Cremer

Beware the unintended consequences of using algorithmic tools for management.
Because of AI’s ability to learn from vast amounts of data and maximize efficiency, companies have predicted that humans working with it will be able to free up their time and expand their creative efforts, thereby driving greater innovation. But, despite the enthusiasm of tech gurus and companies alike, is this really how adopting AI tools will play out? A series of experiments that how algorithmic tools changed the consideration and resources workers were given for creative and innovative work suggest that these tools — specifically, the algorithmic tools that oversee employee productivity — could actually undercut employees’ ability to do this work, and that companies that deploy these tools haphazardly could find their optimism souring.
How will creative work be impacted by artificial intelligence (AI)? With AI’s immense and growing capabilities — it can do everything from structuring work schedules, managing administrative tasks , and giving advice to decision-makers — industry thought leaders are understandably optimistic about its potential. Much of this optimism hinges on the claim that, because of AI’s ability to learn from vast amounts of data and maximize efficiency, humans working with it will be able to free up their time and expand their creative efforts, thereby driving greater innovation. Numerous analyses and corporate reports have been written in favor of this claim.
- SS Shane Schweitzer is an Assistant Professor of Management and Organizational Development at the D’Amore-McKim School of Business.
- David De Cremer is a professor of management and technology at Northeastern University and the Dunton Family Dean of its D’Amore-McKim School of Business. His website is daviddecremer.com .
Partner Center
- Frontiers in Psychology
- Research Topics
Highlights in Cognition: Visual-spatial Processing
Total Downloads
Total Views and Downloads
About this Research Topic
We are pleased to introduce the collection Frontiers in Psychology – Highlights in Cognition: Visual-spatial Processing. As a multifaceted topic that encompasses creativity, brain mechanisms, word processing, attention, and even the interaction of various factors in cognitive tasks, visual-spatial processing is a crucial aspect of human cognition that influences our ability to make remote associations, process visual information, and perform tasks requiring attention and perception. Forming the foundation for numerous cognitive functions and mental processes, is an integral cognitive skill for the formation of remote associations, fostering creative thinking and the generation of innovative ideas. Additionally, it is a cornerstone of how individuals perceive and interpret their surroundings, influencing critical processes like object recognition, spatial navigation, and the comprehension of visual stimuli. The interplay between visual-spatial processing and attention underscores the cognitive aspects of tasks involving visual perception and word recognition. In essence, visual-spatial processing is a fundamental component of cognitive functioning, exerting a pervasive influence on various cognitive domains and profoundly shaping how individuals think, perceive, and engage with their environment. We are hopeful that this topic will help further improve our understanding of visual-spatial Processing, and provide future researchers an insight as to what areas require further inquiry. This collection will welcome and showcase a selection of articles about visual-spatial Processing from a cognition background, authored by leaders in the field. The work presented here highlights the broad diversity of research performed across the cognition field and aims to put a spotlight on the main areas of interest. This collection aims to further support Frontiers’ strong community by shining a spotlight on our authors' highly impactful research.
Keywords : Visual-spatial Processing, Visual perception, Spatial awareness, Object recognition, Spatial cognition, Visual-spatial skills
Important Note : All contributions to this Research Topic must be within the scope of the section and journal to which they are submitted, as defined in their mission statements. Frontiers reserves the right to guide an out-of-scope manuscript to a more suitable section or journal at any stage of peer review.
Topic Editors
Topic coordinators, submission deadlines, participating journals.
Manuscripts can be submitted to this Research Topic via the following journals:
total views
- Demographics
No records found
total views article views downloads topic views
Top countries
Top referring sites, about frontiers research topics.
With their unique mixes of varied contributions from Original Research to Review Articles, Research Topics unify the most influential researchers, the latest key findings and historical advances in a hot research area! Find out more on how to host your own Frontiers Research Topic or contribute to one as an author.
Search code, repositories, users, issues, pull requests...
Provide feedback.
We read every piece of feedback, and take your input very seriously.
Saved searches
Use saved searches to filter your results more quickly.
To see all available qualifiers, see our documentation .
- Notifications
T-Rex2: Towards Generic Object Detection via Text-Visual Prompt Synergy
IDEA-Research/T-Rex
Folders and files, repository files navigation.

A picture speaks volumes, as do the words that frame it.
- Introduction Video 🎥
Turn on the music if possible 🎧
- 2024-03-27 : Online Gradio demo hosted at https://huggingface.co/spaces/Mountchicken/T-Rex2
- 2024-03-26 : New Gradio demo available🤗! Get our API but don't know how to use it? We are now providing a local Gradio demo that provides GUI interface to support your usage. Check here: Gradio APP
What Can T-Rex Do 📝
2. try demo 🎮, interactive visual prompt api, generic visual prompt api, customize visual prompt embedding api, embedding inference api, 4.2. run the gradio demo, 4.3. basic operations, 5. related works, 1. introduction 📚.
Object detection, the ability to locate and identify objects within an image, is a cornerstone of computer vision, pivotal to applications ranging from autonomous driving to content moderation. A notable limitation of traditional object detection models is their closed-set nature. These models are trained on a predetermined set of categories, confining their ability to recognize only those specific categories. The training process itself is arduous, demanding expert knowledge, extensive datasets, and intricate model tuning to achieve desirable accuracy. Moreover, the introduction of a novel object category, exacerbates these challenges, necessitating the entire process to be repeated.
T-Rex2 addresses these limitations by integrating both text and visual prompts in one model, thereby harnessing the strengths of both modalities. The synergy of text and visual prompts equips T-Rex2 with robust zero-shot capabilities, making it a versatile tool in the ever-changing landscape of object detection.

T-Rex2 is well-suited for a variety of real-world applications, including but not limited to: agriculture, industry, livstock and wild animals monitoring, biology, medicine, OCR, retail, electronics, transportation, logistics, and more. T-Rex2 mainly supports three major workflows including interactive visual prompt workflow, generic visual prompt workflow and text prompt workflow. It can cover most of the application scenarios that require object detection
We are now opening online demo for T-Rex2. Check our demo here

3. API Usage Examples📚
We are now opening free API access to T-Rex2. For educators, students, and researchers, we offer an API with extensive usage times to support your educational and research endeavors. You can get API at here request API .
- Full API documentation can be found here .
Install the API package and acquire the API token from the email.
In interactive visual prompt workflow, users can provide visual prompts in boxes or points format on a given image to specify the object to be detected.

In generic visual prompt workflow, users can provide visual prompts on one reference image and detect on the other image.

In this workflow, you cam customize a visual embedding for a object category using multiple images. With this embedding, you can detect on any images.
- You are supposed to get a download link for this visual prompt embedding in safetensors format. Save it and let's use it for embedding_inference .
With the visual prompt embeddings generated from the previous API. You can use it detect on any images.
4. Local Gradio Demo with API🎨

- Install T-Rex2 API if you haven't done so
- Draw Box : Draw a box on the image to specify the object to be detected. Drag the left mouse button to draw a box.
- Draw Point : Draw a point on the image to specify the object to be detected. Click the left mouse button to draw a point.
- Interacive Visual Prompt : Provide visual prompts in boxes or points format on a given image to specify the object to be detected. The Input Target Image and Interactive Visual Prompt Image should be the same
- Generic Visual Prompt : Provide visual prompts on multiple reference images and detect on the other image.
🔥 We release the training and inference code and demo link of DINOv , which can handle in-context visual prompts for open-set and referring detection & segmentation. Check it out!
Contributors 4
- Python 100.0%
Office of the Provost
Academic innovation & student success.
Student Development & Engagement
- Academic Coaching
- College Readiness: TSI
- First Gen & Mentor Tech
- Parent & Family Relations
- Raider Success Hub
- Student Engagement
Support & Success
- Academic Testing Services
- Dream Resource Center
- Learning Center
- Raider Relief
- Supplemental Instruction
- Writing Centers
Academic & Career Advising
- University Advising
- Academic Advisor Professional Development
- University Career Center
Contact TTU
Read our research on: Abortion | Podcasts | Election 2024
Regions & Countries
How temporary protected status has expanded under the biden administration.

Since President Joe Biden took office in January 2021, his administration has greatly expanded the number of immigrants who are eligible for Temporary Protected Status (TPS) – a designation that gives them time-limited permission to live and work in the United States and avoid potential deportation.
The federal government offers TPS to qualifying immigrants who live in the U.S. and come from selected nations that are deemed unsafe to return to because of war, natural disasters or other crises.
Pew Research Center conducted this analysis to determine the number of immigrants in the U.S. who are eligible for Temporary Protected Status (TPS). The federal government, as directed by the president, determines the countries whose immigrants living in the U.S. would be eligible for TPS. TPS is granted to nationals of designated countries and to those with no nationality, but who last habitually lived in a designated country (immigrants). To apply, immigrants must have continuously lived in the U.S. at or before a date specified by the U.S. Department of Homeland Security (DHS).
For this analysis, we collected information about the TPS program published on the DHS website; Federal Register announcements about TPS benefits ; and information from the Congressional Research Service .
In this analysis, TPS beneficiary numbers for most countries are taken from DHS statistics provided to the Congressional Research Service, which exclude recipients who also have lawful permanent resident status or U.S. citizenship. Some may have left the U.S. or died. For immigrants eligible for TPS from the redesignations of Cameroon, Myanmar, Syria and Venezuela, estimates of the number of people eligible were included in the most recent Federal Register notices regarding those countries’ TPS designations.

Nearly 1.2 million of the roughly 21.6 million noncitizen immigrants living in the U.S. are either receiving or eligible for TPS. These immigrants come from 16 countries : Afghanistan, Cameroon, El Salvador, Ethiopia, Haiti, Honduras, Myanmar, Nepal, Nicaragua, Somalia, South Sudan, Sudan, Syria, Ukraine, Venezuela and Yemen.
Federal immigration officials may grant TPS for up to 18 months based on conditions in immigrants’ home countries, and they may repeatedly extend this eligibility if dangerous conditions in those countries persist.
The Biden administration cited dangerous conditions in Cameroon, Myanmar, Syria and Venezuela when it recently expanded TPS protections to immigrants from those countries. The Federal Register provides detailed information about each of these countries’ designations .

The recent TPS expansions continue the Biden administration’s efforts to broaden the program .
Since 2021, the Department of Homeland Security – which oversees the program – has added Afghanistan, Cameroon, Ethiopia, Myanmar, Ukraine and Venezuela to the list of countries whose immigrants may qualify for TPS. It also extended the terms of eligibility for immigrants from most countries that were already covered by TPS.
The Biden administration’s expansions stand in contrast to the Trump administration’s efforts to end TPS for nearly all beneficiaries. On his first day as president, Biden asked Congress to pass legislation that would allow TPS recipients who meet certain conditions to apply immediately for green cards that would let them become lawful permanent residents. Green card holders may be granted U.S. citizenship if they pass additional background checks and meet the usual naturalization conditions of knowledge of English and U.S. civics.
TPS recipients are not currently eligible for permanent residency or U.S. citizenship unless they pursue those statuses through other immigration processes.
Some TPS recipients have lived in the U.S. for decades
Immigrants with TPS live in all 50 states, the District of Columbia and U.S. territories, according to the Congressional Research Service . The largest numbers live in Florida, Texas, California and New York – all of them states with large immigrant populations.
Some current TPS beneficiaries have lived in the U.S. for two decades or more. For example, those from Honduras and Nicaragua have been eligible because of damage from Hurricane Mitch in 1998, provided they have been living in the U.S. since Dec. 30 of that year. And current protections for immigrants from El Salvador apply to those who have lived in the U.S. since Feb. 13, 2001, following a series of earthquakes that killed more than a thousand people and inflicted widespread damage there.
Deferred Enforced Departure also offers protection from deportation
Another form of temporary relief from deportation, called Deferred Enforced Departure (DED), is granted at the president’s discretion, rather than as a result of an administrative process in the U.S. Department of Homeland Security. It usually follows catastrophes in immigrants’ home countries similar to those that have triggered TPS. Currently, certain immigrants from Liberia, Hong Kong and the Palestinian territories are eligible for this benefit and are also allowed to apply for authorization to work. Liberian immigrants with DED have relief until June 30, 2024 , and those from Hong Kong until Feb. 5, 2025 . The president recently enacted DED for immigrants from the Palestinian territories for 18 months starting Feb. 14, 2024.
To be granted TPS, applicants must meet filing deadlines, pay a fee, and prove they have lived in the U.S. continuously since the events that triggered relief from deportation. They must also meet criminal record requirements . For example, they must show that they have not been convicted of any felony or two or more misdemeanors while in the U.S.; persecuted others; or engaged in terrorism.
Once the Department of Homeland Security determines that a nation’s immigrants are eligible for TPS, those immigrants can apply for deportation relief if they entered the U.S. without authorization or entered on a temporary visa that has since expired. Those with a valid temporary visa or another non-immigrant status, such as foreign students, are also eligible to apply.
Federal officials are required to announce 60 days before any TPS designation expires whether it will be extended. Without a decision, it automatically extends for another six months.
Congress and President George H.W. Bush authorized the TPS program in the 1990 immigration law , granting the White House executive power to designate and extend the status to immigrants in the U.S. based on certain criteria.
Note: This is an update of a post originally published Oct. 28, 2021.

Sign up for our weekly newsletter
Fresh data delivered Saturday mornings
Key facts about U.S. immigration policies and Biden’s proposed changes
Most latinos say u.s. immigration system needs big changes, key findings about u.s. immigrants, facts on u.s. immigrants, 2018, most popular.
About Pew Research Center Pew Research Center is a nonpartisan fact tank that informs the public about the issues, attitudes and trends shaping the world. It conducts public opinion polling, demographic research, media content analysis and other empirical social science research. Pew Research Center does not take policy positions. It is a subsidiary of The Pew Charitable Trusts .
IMAGES
VIDEO
COMMENTS
To spot high-quality images, you'll need to draw on your basic visual literacy skills. The icon indicates free access to the linked research on JSTOR. As we've been learning in this visual literacy column, images tell stories. From photographs to illustrations to maps, they offer glimpses into moments beyond our reach and help us better ...
Visual methodologies, specifically autophotography and photo elicitation, are a new and innovative way for nurses and other health and mental health professionals to collect data and research topics in health care. These methods add additional layers of meaning to the data and are a viable method for qualitative research.
A structured method to analyze images can fruitfully assist in the process. Since every research participant has a view on or a way of making sense of the research subject, the method is universal in application. Baart, A., & Roos, V. (2022). An Analytical Tool for Visual Data Analysis: Application to the Mmogo-Method®.
Visual Studies is a is a leading international peer-reviewed journal published on behalf of the International Visual Sociology Association.The journal publishes visually-oriented articles across a range of disciplines, and represents a long-standing commitment to empirical visual research, studies of visual and material culture, the development of visual research methods and the exploration of ...
According to an interesting study, 90% of the information transmitted to the brain is visual. 1 In fact, humans are capable of processing visuals 60,000 times faster than text. 2 This is why the use of research infographics is an important and popular way to communicate complex scientific information in a simple, easy-to-understand way.
Visual research is a qualitative research methodology that relies on artistic mediums to produce and represent knowledge. These artistic mediums include film, ... Images are an essential component for different sorts of inquiries on a wide range of topics and research questions may call for a visual component in a variety of ways. One way could ...
The selection of chapters from the first edition have been fully updated to reflect current developments. New chapters to the second edition cover key topics including picture-sorting techniques, creative methods using artefacts, visual framing analysis, therapeutic uses of images, and various emerging digital technologies and online practices.
London, U.K.: AltaMira Press. Visual and screen-based research practices have a long history in social-science, humanities, education, and creative-arts based disciplines as methods of qualitative research. While approaches may vary substantially across visual anthropology, sociology, history, media, or cultural studies, in each case visual ...
Visual Neuroscience articles from Neuroscience News cover research from science labs, university research departments and science sources around the world. ... crucial for advancing visual prosthesis research. This simulator, designed to mimic the potential vision provided by stimulating the brain's visual cortex with electrodes, is a step ...
Part of the most cited neuroscience journal series, this section explores the representation and processing of visual information within the brain. ... Research Topics; Type at least 3 characters 17 Research Topics Guest edit your own article collection Suggest a topic. Submission.
Current and Future Research Topics. The key issues for visual communication in the new millennium are surprisingly similar to those of 30 years ago, although greater attention is being paid to these issues within communications studies itself. A still largely unmet challenge for visual communication scholars is to scan, chart, and interrogate ...
The Creation and Impact of Visual Narratives for Science and Health Communication. Paige Brown Jarreau. Joana Magalhães. António Fernando Coelho. 34,427 views. 9 articles. Explores the work visual representations do, considering the visualization of society and visual representations in relation to other forms of communication.
The goal of this special edition Research Topic is to shed light on the progress made in the past decade in the visual communication field and on its future challenges to provide a thorough overview of the state of the art of the visual communication field. This article collection will inspire, inform, and provide direction and guidance to ...
Here are some of the most exciting topics. Artistic Freedom vs. Censorship: Art in Nazi Germany. From Canvas to Camera: Photography as Art. Gothic Art in Medieval England. The Death of the Author: Barthes's Theory Debunked. The History of Abstract Expressionism. Art and Culture: An Intellectual History.
Brian Scholl: Research Topics. Lab Research Projects. Research in our laboratory spans several topics in cognitive science, with a primary focus in recent work on visual cognition. Much of our work involves computer-based psychophysical experiments with human adults. In collaboration with several other laboratories, we are also exploring ...
13. As Holmqvist et al. (Citation 2011) explain there is not research that suggests what fixation thresholds are more common. Various research reports (see summary in Holmqvist et al., Citation 2011, pp. 155-156) offer differing recommendations. So, for communication researchers—at present—the best practice is likely to use a similar ...
Visual Aids (Images, Infographics) Incorporate visuals like images, charts, and infographics to make your research visually appealing and easier to understand. ... Choosing interesting topics to research is the first step in this exciting journey. Whether you're exploring the depths of science, the intricacies of culture, or the dynamics of ...
A large number of practical and objective examples of analysis and demonstration, leaving students with sufficient space for thinking and proposing purposeful research topics [1]. Visual ...
Male artists dominate galleries. Our research explored if it's because 'women don't paint very well' - or just discrimination. Robert Hoffmann, RMIT University and Bronwyn Coate, RMIT ...
The interactive, conversational, analytical, and generative features of GenAI offer support for creativity, problem-solving, and processing and digestion of large bodies of information. Therefore ...
A visual topic modeling system called UTOPIAN 22 combines several dimensionality reduction techniques, ... We envision maps of research topics being used internally as part of the ORU's self-assessment and externally as a communication tool describing research trends and developments, which are likely of interest to external reviewers, other ...
113 Great Research Paper Topics. One of the hardest parts of writing a research paper can be just finding a good topic to write about. Fortunately we've done the hard work for you and have compiled a list of 113 interesting research paper topics. They've been organized into ten categories and cover a wide range of subjects so you can easily ...
Visual Methods in the Social Sciences. D. Harper, in International Encyclopedia of the Social & Behavioral Sciences, 2001 4 Publication: Organizational Basis. In the past two decades, visual research in anthropology and sociology has been institutionalized in intellectual organizations such as the Society for Visual Anthropology, a part of the American Anthropological Association, and the ...
June 9, 2021 — New research has revealed that people with the ability to visualize vividly have a stronger connection between their visual network and the regions of the brain linked to decision ...
Research: Leaders Undervalue Creative Work from AI-Managed Teams. by. Shane Schweitzer. and. David De Cremer. March 29, 2024. Illustration by Eddie Guy. Summary. Because of AI's ability to learn ...
We are pleased to introduce the collection Frontiers in Psychology - Highlights in Cognition: Visual-spatial Processing.As a multifaceted topic that encompasses creativity, brain mechanisms, word processing, attention, and even the interaction of various factors in cognitive tasks, visual-spatial processing is a crucial aspect of human cognition that influences our ability to make remote ...
T-Rex2: Towards Generic Object Detection via Text-Visual Prompt Synergy - IDEA-Research/T-Rex
George Mason University student researchers were among those that gathered on the Fairfax Campus in March for the Access to Research and Inclusive Excellence (ARIE) National Conference. In addition to speakers and breakout sessions on various topics, the two-day conference opened with a poster session with 49 groups presenting their research.
VDOM DHTML e>Document Moved. Object Moved. This document may be found here.
Since President Joe Biden took office in January 2021, his administration has greatly expanded the number of immigrants who are eligible for Temporary Protected Status (TPS) - a designation that gives them time-limited permission to live and work in the United States and avoid potential deportation. The federal government offers TPS to ...