

What Is Statistical Validity? -Understanding Trends in Validating Research Data
With an aim to understand, analyze, and draw conclusions based on the enormous data often presented in complex formats, it is imperative to validate it statistically. In research, decision modeling and inferential aspects depend on the statistical validity of research data. Thus, it becomes imperative for researchers and statisticians to develop novel frameworks in the statistical paradigm to evaluate and validate research data. In this article, we will explore the recent trends in the statistical validity of research data.
Table of Contents
What Is Statistical Validity?
Statistical validity can be defined as the extent to which drawn conclusions of a research study can be considered accurate and reliable from a statistical test. To achieve statistical validity , it is essential for researchers to have sufficient data and also choose the right statistical approach to analyze that data. Furthermore, statistical validity also refers to whether statistics derived from a research study are in agreement with its scientific laws. Thus, if a given data set draws a conclusion after experimentation, it is said to be scientifically valid and relies on the mathematical and statistical laws of the principal study.
Why Is It Important to Determine Statistical Validity of Research Data?
It is important to determine statistical validity of research data because;
- It allows the analyst to know whether the results of the conducted experiments can be accepted with confidence or not.
- It increases the probability of research reproducibility.
- The researcher understands whether a method of analysis is suitable for its intended use to derive conclusive results.
- It allows the researcher to ensure the validity of research based on its criteria of method selection .
- Furthermore, it also allows the researcher to optimize the number of assays and satisfy the validation criteria of a study.
What Are the Different Types of Statistical Validities?
Statistical validities relevant to research are broadly classified into 6 categories:
1. Construct Validity:
- It ensures that the actual experimentation and data collection conforms to the theory that is being studied.
- It is reflected by a questionnaire regarding public opinion. It provides a clearer image of what people think of a certain issue.
- Construct validity is further divided into 2 types: A. Convergent Validity – It ensures that if the required theory predicts that one measure is correlated with the other, then the statistics confirm this. B. Divergent or Discriminant Validity – It ensures that if the required theory predicts that one variable doesn’t correlate with others, then statistics need to confirm this.
2. Content Validity:
This validity ensures that the test or questionnaire that is prepared completely covers all aspects of the variable being studied.
3. Face Validity:
This type of validity estimates whether the given experiment actually mimics the claims that are being verified.
4. Conclusion Validity:
This validity ensures that the conclusion is achieved from the data sets obtained from the experiment are actually correct and justified without any violations.
5. Internal Validity:
It is a measure of the relationship between cause and effect being studied in the experiment.
6. External Validity:
This validity is a measure of how to apply the results from a particular experiment to more general populations. Furthermore, it informs the analyst whether or not to generalize the results of a particular experiment to all other populations or to some populations with particular characteristics.
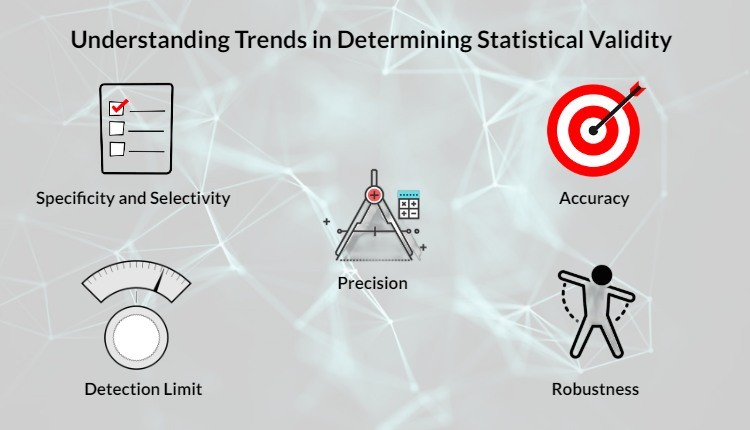
Understanding Trends in Determining Statistical Validity
1. specificity and selectivity.
Statistical validity is relevant to specificity—a quantitative indication of the extent to which a method can distinguish between the subject of interest and interfering substances on the basis of signals produced under actual experimental conditions. In case of random interferences, they should be determined using representative blank samples.
2. Accuracy
Accuracy is the closeness of agreement between the true value of the subject being analyzed and the mean result obtained by applying experimental procedure to a larger population or sample size.
3. Precision
While comparing results, they should be analyzed based on their precision of repeatability and reproducibility . In statistics, repeatability can be termed as intra-assay precision.
4. Detection Limit
Detection limit can be determined with several approaches: visual inspection, signal-to-noise, and using the standard deviation of the response and the slope. While presenting, researchers must also ensure that the detection limit and the method used for determining the detection limit is also displayed.
5. Robustness
Robustness of data is the measure of how effectively the performance of the research method stands up to not exactly similar implementation of the approach. Exact same results can only be replicated following a set procedure; however, to avoid the performance to be severely affected, the procedure must be carried out with sufficient care following the procedure efficiently. Such impacting aspects should be identified and their influence on method’s performance must be evaluated using tests for robustness.
What Are the Challenges in Determining Statistical Validity of Research Data?
- Methods are generally developed by the R&D department, whilst the quality assurance and quality control departments conduct data validation. The transfer of methods and data from one department to another is important and must be done scrupulously to ensure proper validation.
- If methods are not built on research robustness , the results delivered may also be affected, eventually leading to lack of efficiency in quality testing encountering lengthy and complicated validation process.
- Inadequate knowledge of design and execution of the studies will hamper the statistical validity of research data.
Statistical validity helps ensure that the developed methods qualify and are capable of their intended use. Which methods do you follow to ensure statistical validity of your research data? Let us know about it in the comments section below.

Good article to read and gain information.
nice article
This article is really helpful thanks once again. I love this site
Rate this article Cancel Reply
Your email address will not be published.

Enago Academy's Most Popular Articles

- Promoting Research
Plain Language Summary — Communicating your research to bridge the academic-lay gap
Science can be complex, but does that mean it should not be accessible to the…

- Reporting Research
Choosing the Right Analytical Approach: Thematic analysis vs. content analysis for data interpretation
In research, choosing the right approach to understand data is crucial for deriving meaningful insights.…

Demystifying the Role of Confounding Variables in Research
In the realm of scientific research, the pursuit of knowledge often involves complex investigations, meticulous…

Research Interviews: An effective and insightful way of data collection
Research interviews play a pivotal role in collecting data for various academic, scientific, and professional…

Planning Your Data Collection: Designing methods for effective research
Planning your research is very important to obtain desirable results. In research, the relevance of…
Choosing the Right Analytical Approach: Thematic analysis vs. content analysis for…

Sign-up to read more
Subscribe for free to get unrestricted access to all our resources on research writing and academic publishing including:
- 2000+ blog articles
- 50+ Webinars
- 10+ Expert podcasts
- 50+ Infographics
- 10+ Checklists
- Research Guides
We hate spam too. We promise to protect your privacy and never spam you.
I am looking for Editing/ Proofreading services for my manuscript Tentative date of next journal submission:

What should universities' stance be on AI tools in research and academic writing?
Popular searches
- How to Get Participants For Your Study
- How to Do Segmentation?
- Conjoint Preference Share Simulator
- MaxDiff Analysis
- Likert Scales
- Reliability & Validity
Request consultation
Do you need support in running a pricing or product study? We can help you with agile consumer research and conjoint analysis.
Looking for an online survey platform?
Conjointly offers a great survey tool with multiple question types, randomisation blocks, and multilingual support. The Basic tier is always free.
Research Methods Knowledge Base
- Navigating the Knowledge Base
- Foundations
- Measurement
- Research Design
- Threats to Conclusion Validity
- Improving Conclusion Validity
- Statistical Power
- Data Preparation
- Descriptive Statistics
- Inferential Statistics
- Table of Contents
Fully-functional online survey tool with various question types, logic, randomisation, and reporting for unlimited number of surveys.
Completely free for academics and students .
Conclusion Validity
Of the four types of validity (see also internal validity , construct validity and external validity ) conclusion validity is undoubtedly the least considered and most misunderstood. That’s probably due to the fact that it was originally labeled ‘statistical’ conclusion validity and you know how even the mere mention of the word statistics will scare off most of the human race!
In many ways, conclusion validity is the most important of the four validity types because it is relevant whenever we are trying to decide if there is a relationship in our observations (and that’s one of the most basic aspects of any analysis). Perhaps we should start with an attempt at a definition:
Conclusion validity is the degree to which conclusions we reach about relationships in our data are reasonable.
For instance, if we’re doing a study that looks at the relationship between socioeconomic status (SES) and attitudes about capital punishment, we eventually want to reach some conclusion. Based on our data, we may conclude that there is a positive relationship, that persons with higher SES tend to have a more positive view of capital punishment while those with lower SES tend to be more opposed. Conclusion validity is the degree to which the conclusion we reach is credible or believable.
Although conclusion validity was originally thought to be a statistical inference issue, it has become more apparent that it is also relevant in qualitative research. For example, in an observational field study of homeless adolescents the researcher might, on the basis of field notes, see a pattern that suggests that teenagers on the street who use drugs are more likely to be involved in more complex social networks and to interact with a more varied group of people. Although this conclusion or inference may be based entirely on impressionistic data, we can ask whether it has conclusion validity, that is, whether it is a reasonable conclusion about a relationship in our observations.
Whenever you investigate a relationship, you essentially have two possible conclusions — either there is a relationship in your data or there isn’t. In either case, however, you could be wrong in your conclusion. You might conclude that there is a relationship when in fact there is not, or you might infer that there isn’t a relationship when in fact there is (but you didn’t detect it!). So, we have to consider all of these possibilities when we talk about conclusion validity.
It’s important to realize that conclusion validity is an issue whenever you conclude there is a relationship, even when the relationship is between some program (or treatment) and some outcome. In other words, conclusion validity also pertains to causal relationships. How do we distinguish it from internal validity which is also involved with causal relationships? Conclusion validity is only concerned with whether there is a relationship. For instance, in a program evaluation, we might conclude that there is a positive relationship between our educational program and achievement test scores — students in the program get higher scores and students not in the program get lower ones. Conclusion validity is essentially whether that relationship is a reasonable one or not, given the data. But it is possible that we will conclude that, while there is a relationship between the program and outcome, the program didn’t cause the outcome. Perhaps some other factor, and not our program, was responsible for the outcome in this study. For instance, the observed differences in the outcome could be due to the fact that the program group was smarter than the comparison group to begin with. Our observed posttest differences between these groups could be due to this initial difference and not be the result of our program. This issue — the possibility that some other factor than our program caused the outcome — is what internal validity is all about. So, it is possible that in a study we can conclude that our program and outcome are related (conclusion validity) and also conclude that the outcome was caused by some factor other than the program (i.e., we don’t have internal validity).
We’ll begin this discussion by considering the major threats to conclusion validity , the different reasons you might be wrong in concluding that there is or isn’t a relationship. You’ll see that there are several key reasons why reaching conclusions about relationships is so difficult. One major problem is that it is often hard to see a relationship because our measures or observations have low reliability — they are too weak relative to all of the ’noise’ in the environment. Another issue is that the relationship we are looking for may be a weak one and seeing it is a bit like looking for a needle in the haystack. Sometimes the problem is that we just didn’t collect enough information to see the relationship even if it is there. All of these problems are related to the idea of statistical power and so we’ll spend some time trying to understand what ‘power’ is in this context. Finally, we need to recognize that we have some control over our ability to detect relationships, and we’ll conclude with some suggestions for improving conclusion validity .
Cookie Consent
Conjointly uses essential cookies to make our site work. We also use additional cookies in order to understand the usage of the site, gather audience analytics, and for remarketing purposes.
For more information on Conjointly's use of cookies, please read our Cookie Policy .
Which one are you?
I am new to conjointly, i am already using conjointly.

Credibility, Validity, and Assumptions in Program Evaluation Methodology pp 105–118 Cite as
Validity in Analysis, Interpretation, and Conclusions
- Apollo M. Nkwake 2
- First Online: 14 December 2023
30 Accesses
This phase of the evaluation process involves use of appropriate methods and tools for cleaning, processing, and analysis; interpreting the results to determine what they mean; applying appropriate approaches for comparing, verifying, and triangulating results; and lastly, documenting appropriate conclusions and recommendations. Therefore, critical validity questions include:
Are conclusions and inferences accurately derived from evaluation data and measures that generate this data?
To what extent can findings be applied to situations other than the one in which evaluation is conducted?
The main forms of validity affected at this stage include statistical conclusion, internal validity, and external validity. This chapter discusses the meaning, preconditions, and assumptions of these validity types.
This is a preview of subscription content, log in via an institution .
Buying options
- Available as PDF
- Read on any device
- Instant download
- Own it forever
- Available as EPUB and PDF
- Durable hardcover edition
- Dispatched in 3 to 5 business days
- Free shipping worldwide - see info
Tax calculation will be finalised at checkout
Purchases are for personal use only
Descriptive validity concerns the adequacy of the presentation of key features of an evaluation in a research report. The quality of documentation affects the usefulness of an evaluation. Farrington ( 2003 ) argues that a well-written evaluation report needs document nothing less than the following:
Design of the study, for example, how were participants allocated to different comparison groups and conditions?
Characteristics of study participants and settings (e.g., age and gender of individuals, sociodemographic features of areas).
Sample sizes and attrition rates.
Hypotheses to be tested and theories from which they are derived.
The operational definition and detailed description of the intervention’s theory of change (including its intensity and duration).
Implementation details and program delivery personnel.
Description of what treatment the control or other comparison groups received.
The operational definition and measurement of the outcome before and after the intervention.
The reliability and validity of outcome measures.
The follow-up period after the intervention (where applicable).
Effect size, confidence intervals, statistical significance, and statistical methods used.
How independent and extraneous variables were controlled so that it was possible to disentangle the impact of the intervention or how threats to internal validity were ruled out.
Who knows what about the intervention?
Conflict of interest issues: who funded the intervention, and how independent were the researchers? (Farrington, 2003 ).
Calloway, M., & Belyea, M. J. (1988). Ensuring validity using coworker samples: A situationally driven approach. Evaluation Review, 12 (2), 186–195.
Article Google Scholar
Campbell, D. T. (1986). Relabeling internal and external validity for applied social scientists, In W. M. K. Trochim, Advances in quasi-experimental design and analysis. New Directions for Program Education , 31 (Fall):67–78.
Google Scholar
Chen, H. T., & Garbe, P. (2011). Assessing program outcomes from the bottom-up approach: An innovative perspective to outcome evaluation. In H. T. Chen, S. I. Donaldson, & M. M. Mark (Eds.), Advancing validity in outcome evaluation: Theory and practice. New directions for evaluation , 130 (summer), 93–106.
Cook, T. D., Campbell, D. T., & Peracchio, L. (1990). Quasi experimentation. In M. D. Dunnette & L. M. Hough (Eds.), Handbook of industrial and organizational psychology (pp. 491–576).
Cronbach, L. H., Glesser, G. C., Nanda, H., & Rajaratnam, N. (1972). The dependability of behavioral measurements: Theory of generalizability for scores and profiles . Wiley.
Dikmen, S., Reitan, R. M., & Temkin, N. R. (1983). Neuropsychological recovery in head injury. Archives of Neurology, 40 , 333–338.
Article PubMed Google Scholar
Farrington, D. F. (2003). Methodological quality standards for evaluation research. Annals of the American Academy of Political and Social Science, 587 (2003), 49–68.
Field, A. (2014). Discovering statistics using IBM SPSS . London: Sage.
Glasgow, R. E., Klesges, L. M., Dzewaltowski, D. A., Bull, S. S., & Estabrooks, P. (2004). The future of health behavior change research: What is needed to improve translation of research into health promotion practice? Annals of Behavioral Medicine, 27 , 3–12.
Glasgow, R. E., Green, L. W., & Ammerman, A. (2007). A focus on external validity. Evaluation & the Health Professions, 30 (2), 115–117.
Green, L. W., & Glasgow, R. E. (2006). Evaluating the relevance, generalization, and applicability of research issues in external validation and translation methodology. Evaluation & the Health Professions, 29 (1), 126–153.
Hahn, G. J., & Meeker, W. Q. (1993). assumptions for statistical inference. The American Statistician, 47 (1), 1–11.
House, E. R. (1980). The logic of evaluative argument, monograph #7 . Center for the Study of Evaluation, UCLA.
House, E. R. (2008). Blowback: Consequences of evaluation for evaluation. American Journal of Evaluation, 29 , 416–426.
Julnes, G. (2011). Reframing validity in research and evaluation: A multidimensional, systematic model of valid inference. In H. T. Chen, S. I. Donaldson, & M. M. Mark (Eds.), Advancing validity in outcome evaluation: Theory and practice. New Directions for Evaluation , 130 , 55–67.
Klass, G. M. (1984). Drawing inferences from policy experiments: Issues of external validity and conflict of interest. Evaluation Review, 8 (1), 3–24.
Mark, M. M. (2011). New (and old) directions for validity concerning generalizability. In H. T. Chen, S. I. Donaldson, & M. M. Mark (Eds.), Advancing validity in outcome evaluation: Theory and practice. New directions for evaluation, 130, 31–42.
Peck, L. R., Kim, Y., & Lucio, J. (2012). An empirical examination of validity in evaluation. American Journal of Evaluation, 0 (0), 1–16.
Reichardt, C. S. (2011). Criticisms of and an alternative to the Shadish, Cook, and Campbell validity typology. In H. T. Chen, S. I. Donaldson, & M. M. Mark (Eds.), Advancing validity in outcome evaluation: Theory and practice. New directions for evaluation , 130, 43–53.
Shadish, W. R., Cook, T. D., & Leviton, L. C. (1991). Foundations of program evaluation: Theories of practice . Sage.
Shadish, W. R., Cook, T. D., & Campbell, D. T. (2002a). Experimental and quasi-experimental design for generalized causal inference . Houghton Mifflin.
Shadish, W. R., Cook, T. D., & Campbell, D. T. (2002b). Experimental and quasi-experimental designs for generalized causal inference . Houghton Mifflin.
Stone, R. (1993). The assumptions on which causal inferences rest. Journal of the Royal Statistical Society. Series B (Methodological), 55 (2), 455–466.
Tebes, J. K., Snow, D. L., & Arthur, M. W. (1992). Panel attrition and external validity in the short-term follow-up study of adolescent substance use. Evaluation Review, 16 (2), 151–170.
Tunis, S. R., Stryer, D. B., & Clancy, C. M. (2003). Practical clinical trials. Increasing the value of clinical research for decision making in clinical and health policy. Journal of the American Medical Association, 290 , 1624–1632.
Yeaton, W. H., & Sechrest, L. (1986). Use and misuse of no-difference findings in eliminating threats to validity. Evaluation Review, 10 (6), 836–852.
Download references
Author information
Authors and affiliations.
The Questions Team, Frederick, MD, USA
Apollo M. Nkwake
You can also search for this author in PubMed Google Scholar
Rights and permissions
Reprints and permissions
Copyright information
© 2023 The Author(s), under exclusive license to Springer Nature Switzerland AG
About this chapter
Cite this chapter.
Nkwake, A.M. (2023). Validity in Analysis, Interpretation, and Conclusions. In: Credibility, Validity, and Assumptions in Program Evaluation Methodology. Springer, Cham. https://doi.org/10.1007/978-3-031-45614-5_6
Download citation
DOI : https://doi.org/10.1007/978-3-031-45614-5_6
Published : 14 December 2023
Publisher Name : Springer, Cham
Print ISBN : 978-3-031-45613-8
Online ISBN : 978-3-031-45614-5
eBook Packages : Behavioral Science and Psychology Behavioral Science and Psychology (R0)
Share this chapter
Anyone you share the following link with will be able to read this content:
Sorry, a shareable link is not currently available for this article.
Provided by the Springer Nature SharedIt content-sharing initiative
- Publish with us
Policies and ethics
- Find a journal
- Track your research
- Search Menu
- Browse content in Arts and Humanities
- Browse content in Archaeology
- Anglo-Saxon and Medieval Archaeology
- Archaeological Methodology and Techniques
- Archaeology by Region
- Archaeology of Religion
- Archaeology of Trade and Exchange
- Biblical Archaeology
- Contemporary and Public Archaeology
- Environmental Archaeology
- Historical Archaeology
- History and Theory of Archaeology
- Industrial Archaeology
- Landscape Archaeology
- Mortuary Archaeology
- Prehistoric Archaeology
- Underwater Archaeology
- Urban Archaeology
- Zooarchaeology
- Browse content in Architecture
- Architectural Structure and Design
- History of Architecture
- Residential and Domestic Buildings
- Theory of Architecture
- Browse content in Art
- Art Subjects and Themes
- History of Art
- Industrial and Commercial Art
- Theory of Art
- Biographical Studies
- Byzantine Studies
- Browse content in Classical Studies
- Classical History
- Classical Philosophy
- Classical Mythology
- Classical Literature
- Classical Reception
- Classical Art and Architecture
- Classical Oratory and Rhetoric
- Greek and Roman Papyrology
- Greek and Roman Epigraphy
- Greek and Roman Law
- Greek and Roman Archaeology
- Late Antiquity
- Religion in the Ancient World
- Digital Humanities
- Browse content in History
- Colonialism and Imperialism
- Diplomatic History
- Environmental History
- Genealogy, Heraldry, Names, and Honours
- Genocide and Ethnic Cleansing
- Historical Geography
- History by Period
- History of Emotions
- History of Agriculture
- History of Education
- History of Gender and Sexuality
- Industrial History
- Intellectual History
- International History
- Labour History
- Legal and Constitutional History
- Local and Family History
- Maritime History
- Military History
- National Liberation and Post-Colonialism
- Oral History
- Political History
- Public History
- Regional and National History
- Revolutions and Rebellions
- Slavery and Abolition of Slavery
- Social and Cultural History
- Theory, Methods, and Historiography
- Urban History
- World History
- Browse content in Language Teaching and Learning
- Language Learning (Specific Skills)
- Language Teaching Theory and Methods
- Browse content in Linguistics
- Applied Linguistics
- Cognitive Linguistics
- Computational Linguistics
- Forensic Linguistics
- Grammar, Syntax and Morphology
- Historical and Diachronic Linguistics
- History of English
- Language Evolution
- Language Reference
- Language Acquisition
- Language Variation
- Language Families
- Lexicography
- Linguistic Anthropology
- Linguistic Theories
- Linguistic Typology
- Phonetics and Phonology
- Psycholinguistics
- Sociolinguistics
- Translation and Interpretation
- Writing Systems
- Browse content in Literature
- Bibliography
- Children's Literature Studies
- Literary Studies (Romanticism)
- Literary Studies (American)
- Literary Studies (Asian)
- Literary Studies (European)
- Literary Studies (Eco-criticism)
- Literary Studies (Modernism)
- Literary Studies - World
- Literary Studies (1500 to 1800)
- Literary Studies (19th Century)
- Literary Studies (20th Century onwards)
- Literary Studies (African American Literature)
- Literary Studies (British and Irish)
- Literary Studies (Early and Medieval)
- Literary Studies (Fiction, Novelists, and Prose Writers)
- Literary Studies (Gender Studies)
- Literary Studies (Graphic Novels)
- Literary Studies (History of the Book)
- Literary Studies (Plays and Playwrights)
- Literary Studies (Poetry and Poets)
- Literary Studies (Postcolonial Literature)
- Literary Studies (Queer Studies)
- Literary Studies (Science Fiction)
- Literary Studies (Travel Literature)
- Literary Studies (War Literature)
- Literary Studies (Women's Writing)
- Literary Theory and Cultural Studies
- Mythology and Folklore
- Shakespeare Studies and Criticism
- Browse content in Media Studies
- Browse content in Music
- Applied Music
- Dance and Music
- Ethics in Music
- Ethnomusicology
- Gender and Sexuality in Music
- Medicine and Music
- Music Cultures
- Music and Media
- Music and Religion
- Music and Culture
- Music Education and Pedagogy
- Music Theory and Analysis
- Musical Scores, Lyrics, and Libretti
- Musical Structures, Styles, and Techniques
- Musicology and Music History
- Performance Practice and Studies
- Race and Ethnicity in Music
- Sound Studies
- Browse content in Performing Arts
- Browse content in Philosophy
- Aesthetics and Philosophy of Art
- Epistemology
- Feminist Philosophy
- History of Western Philosophy
- Metaphysics
- Moral Philosophy
- Non-Western Philosophy
- Philosophy of Language
- Philosophy of Mind
- Philosophy of Perception
- Philosophy of Science
- Philosophy of Action
- Philosophy of Law
- Philosophy of Religion
- Philosophy of Mathematics and Logic
- Practical Ethics
- Social and Political Philosophy
- Browse content in Religion
- Biblical Studies
- Christianity
- East Asian Religions
- History of Religion
- Judaism and Jewish Studies
- Qumran Studies
- Religion and Education
- Religion and Health
- Religion and Politics
- Religion and Science
- Religion and Law
- Religion and Art, Literature, and Music
- Religious Studies
- Browse content in Society and Culture
- Cookery, Food, and Drink
- Cultural Studies
- Customs and Traditions
- Ethical Issues and Debates
- Hobbies, Games, Arts and Crafts
- Lifestyle, Home, and Garden
- Natural world, Country Life, and Pets
- Popular Beliefs and Controversial Knowledge
- Sports and Outdoor Recreation
- Technology and Society
- Travel and Holiday
- Visual Culture
- Browse content in Law
- Arbitration
- Browse content in Company and Commercial Law
- Commercial Law
- Company Law
- Browse content in Comparative Law
- Systems of Law
- Competition Law
- Browse content in Constitutional and Administrative Law
- Government Powers
- Judicial Review
- Local Government Law
- Military and Defence Law
- Parliamentary and Legislative Practice
- Construction Law
- Contract Law
- Browse content in Criminal Law
- Criminal Procedure
- Criminal Evidence Law
- Sentencing and Punishment
- Employment and Labour Law
- Environment and Energy Law
- Browse content in Financial Law
- Banking Law
- Insolvency Law
- History of Law
- Human Rights and Immigration
- Intellectual Property Law
- Browse content in International Law
- Private International Law and Conflict of Laws
- Public International Law
- IT and Communications Law
- Jurisprudence and Philosophy of Law
- Law and Politics
- Law and Society
- Browse content in Legal System and Practice
- Courts and Procedure
- Legal Skills and Practice
- Primary Sources of Law
- Regulation of Legal Profession
- Medical and Healthcare Law
- Browse content in Policing
- Criminal Investigation and Detection
- Police and Security Services
- Police Procedure and Law
- Police Regional Planning
- Browse content in Property Law
- Personal Property Law
- Study and Revision
- Terrorism and National Security Law
- Browse content in Trusts Law
- Wills and Probate or Succession
- Browse content in Medicine and Health
- Browse content in Allied Health Professions
- Arts Therapies
- Clinical Science
- Dietetics and Nutrition
- Occupational Therapy
- Operating Department Practice
- Physiotherapy
- Radiography
- Speech and Language Therapy
- Browse content in Anaesthetics
- General Anaesthesia
- Neuroanaesthesia
- Clinical Neuroscience
- Browse content in Clinical Medicine
- Acute Medicine
- Cardiovascular Medicine
- Clinical Genetics
- Clinical Pharmacology and Therapeutics
- Dermatology
- Endocrinology and Diabetes
- Gastroenterology
- Genito-urinary Medicine
- Geriatric Medicine
- Infectious Diseases
- Medical Toxicology
- Medical Oncology
- Pain Medicine
- Palliative Medicine
- Rehabilitation Medicine
- Respiratory Medicine and Pulmonology
- Rheumatology
- Sleep Medicine
- Sports and Exercise Medicine
- Community Medical Services
- Critical Care
- Emergency Medicine
- Forensic Medicine
- Haematology
- History of Medicine
- Browse content in Medical Skills
- Clinical Skills
- Communication Skills
- Nursing Skills
- Surgical Skills
- Browse content in Medical Dentistry
- Oral and Maxillofacial Surgery
- Paediatric Dentistry
- Restorative Dentistry and Orthodontics
- Surgical Dentistry
- Medical Ethics
- Medical Statistics and Methodology
- Browse content in Neurology
- Clinical Neurophysiology
- Neuropathology
- Nursing Studies
- Browse content in Obstetrics and Gynaecology
- Gynaecology
- Occupational Medicine
- Ophthalmology
- Otolaryngology (ENT)
- Browse content in Paediatrics
- Neonatology
- Browse content in Pathology
- Chemical Pathology
- Clinical Cytogenetics and Molecular Genetics
- Histopathology
- Medical Microbiology and Virology
- Patient Education and Information
- Browse content in Pharmacology
- Psychopharmacology
- Browse content in Popular Health
- Caring for Others
- Complementary and Alternative Medicine
- Self-help and Personal Development
- Browse content in Preclinical Medicine
- Cell Biology
- Molecular Biology and Genetics
- Reproduction, Growth and Development
- Primary Care
- Professional Development in Medicine
- Browse content in Psychiatry
- Addiction Medicine
- Child and Adolescent Psychiatry
- Forensic Psychiatry
- Learning Disabilities
- Old Age Psychiatry
- Psychotherapy
- Browse content in Public Health and Epidemiology
- Epidemiology
- Public Health
- Browse content in Radiology
- Clinical Radiology
- Interventional Radiology
- Nuclear Medicine
- Radiation Oncology
- Reproductive Medicine
- Browse content in Surgery
- Cardiothoracic Surgery
- Gastro-intestinal and Colorectal Surgery
- General Surgery
- Neurosurgery
- Paediatric Surgery
- Peri-operative Care
- Plastic and Reconstructive Surgery
- Surgical Oncology
- Transplant Surgery
- Trauma and Orthopaedic Surgery
- Vascular Surgery
- Browse content in Science and Mathematics
- Browse content in Biological Sciences
- Aquatic Biology
- Biochemistry
- Bioinformatics and Computational Biology
- Developmental Biology
- Ecology and Conservation
- Evolutionary Biology
- Genetics and Genomics
- Microbiology
- Molecular and Cell Biology
- Natural History
- Plant Sciences and Forestry
- Research Methods in Life Sciences
- Structural Biology
- Systems Biology
- Zoology and Animal Sciences
- Browse content in Chemistry
- Analytical Chemistry
- Computational Chemistry
- Crystallography
- Environmental Chemistry
- Industrial Chemistry
- Inorganic Chemistry
- Materials Chemistry
- Medicinal Chemistry
- Mineralogy and Gems
- Organic Chemistry
- Physical Chemistry
- Polymer Chemistry
- Study and Communication Skills in Chemistry
- Theoretical Chemistry
- Browse content in Computer Science
- Artificial Intelligence
- Computer Architecture and Logic Design
- Game Studies
- Human-Computer Interaction
- Mathematical Theory of Computation
- Programming Languages
- Software Engineering
- Systems Analysis and Design
- Virtual Reality
- Browse content in Computing
- Business Applications
- Computer Security
- Computer Games
- Computer Networking and Communications
- Digital Lifestyle
- Graphical and Digital Media Applications
- Operating Systems
- Browse content in Earth Sciences and Geography
- Atmospheric Sciences
- Environmental Geography
- Geology and the Lithosphere
- Maps and Map-making
- Meteorology and Climatology
- Oceanography and Hydrology
- Palaeontology
- Physical Geography and Topography
- Regional Geography
- Soil Science
- Urban Geography
- Browse content in Engineering and Technology
- Agriculture and Farming
- Biological Engineering
- Civil Engineering, Surveying, and Building
- Electronics and Communications Engineering
- Energy Technology
- Engineering (General)
- Environmental Science, Engineering, and Technology
- History of Engineering and Technology
- Mechanical Engineering and Materials
- Technology of Industrial Chemistry
- Transport Technology and Trades
- Browse content in Environmental Science
- Applied Ecology (Environmental Science)
- Conservation of the Environment (Environmental Science)
- Environmental Sustainability
- Environmentalist Thought and Ideology (Environmental Science)
- Management of Land and Natural Resources (Environmental Science)
- Natural Disasters (Environmental Science)
- Nuclear Issues (Environmental Science)
- Pollution and Threats to the Environment (Environmental Science)
- Social Impact of Environmental Issues (Environmental Science)
- History of Science and Technology
- Browse content in Materials Science
- Ceramics and Glasses
- Composite Materials
- Metals, Alloying, and Corrosion
- Nanotechnology
- Browse content in Mathematics
- Applied Mathematics
- Biomathematics and Statistics
- History of Mathematics
- Mathematical Education
- Mathematical Finance
- Mathematical Analysis
- Numerical and Computational Mathematics
- Probability and Statistics
- Pure Mathematics
- Browse content in Neuroscience
- Cognition and Behavioural Neuroscience
- Development of the Nervous System
- Disorders of the Nervous System
- History of Neuroscience
- Invertebrate Neurobiology
- Molecular and Cellular Systems
- Neuroendocrinology and Autonomic Nervous System
- Neuroscientific Techniques
- Sensory and Motor Systems
- Browse content in Physics
- Astronomy and Astrophysics
- Atomic, Molecular, and Optical Physics
- Biological and Medical Physics
- Classical Mechanics
- Computational Physics
- Condensed Matter Physics
- Electromagnetism, Optics, and Acoustics
- History of Physics
- Mathematical and Statistical Physics
- Measurement Science
- Nuclear Physics
- Particles and Fields
- Plasma Physics
- Quantum Physics
- Relativity and Gravitation
- Semiconductor and Mesoscopic Physics
- Browse content in Psychology
- Affective Sciences
- Clinical Psychology
- Cognitive Psychology
- Cognitive Neuroscience
- Criminal and Forensic Psychology
- Developmental Psychology
- Educational Psychology
- Evolutionary Psychology
- Health Psychology
- History and Systems in Psychology
- Music Psychology
- Neuropsychology
- Organizational Psychology
- Psychological Assessment and Testing
- Psychology of Human-Technology Interaction
- Psychology Professional Development and Training
- Research Methods in Psychology
- Social Psychology
- Browse content in Social Sciences
- Browse content in Anthropology
- Anthropology of Religion
- Human Evolution
- Medical Anthropology
- Physical Anthropology
- Regional Anthropology
- Social and Cultural Anthropology
- Theory and Practice of Anthropology
- Browse content in Business and Management
- Business Ethics
- Business Strategy
- Business History
- Business and Technology
- Business and Government
- Business and the Environment
- Comparative Management
- Corporate Governance
- Corporate Social Responsibility
- Entrepreneurship
- Health Management
- Human Resource Management
- Industrial and Employment Relations
- Industry Studies
- Information and Communication Technologies
- International Business
- Knowledge Management
- Management and Management Techniques
- Operations Management
- Organizational Theory and Behaviour
- Pensions and Pension Management
- Public and Nonprofit Management
- Strategic Management
- Supply Chain Management
- Browse content in Criminology and Criminal Justice
- Criminal Justice
- Criminology
- Forms of Crime
- International and Comparative Criminology
- Youth Violence and Juvenile Justice
- Development Studies
- Browse content in Economics
- Agricultural, Environmental, and Natural Resource Economics
- Asian Economics
- Behavioural Finance
- Behavioural Economics and Neuroeconomics
- Econometrics and Mathematical Economics
- Economic History
- Economic Systems
- Economic Methodology
- Economic Development and Growth
- Financial Markets
- Financial Institutions and Services
- General Economics and Teaching
- Health, Education, and Welfare
- History of Economic Thought
- International Economics
- Labour and Demographic Economics
- Law and Economics
- Macroeconomics and Monetary Economics
- Microeconomics
- Public Economics
- Urban, Rural, and Regional Economics
- Welfare Economics
- Browse content in Education
- Adult Education and Continuous Learning
- Care and Counselling of Students
- Early Childhood and Elementary Education
- Educational Equipment and Technology
- Educational Strategies and Policy
- Higher and Further Education
- Organization and Management of Education
- Philosophy and Theory of Education
- Schools Studies
- Secondary Education
- Teaching of a Specific Subject
- Teaching of Specific Groups and Special Educational Needs
- Teaching Skills and Techniques
- Browse content in Environment
- Applied Ecology (Social Science)
- Climate Change
- Conservation of the Environment (Social Science)
- Environmentalist Thought and Ideology (Social Science)
- Natural Disasters (Environment)
- Social Impact of Environmental Issues (Social Science)
- Browse content in Human Geography
- Cultural Geography
- Economic Geography
- Political Geography
- Browse content in Interdisciplinary Studies
- Communication Studies
- Museums, Libraries, and Information Sciences
- Browse content in Politics
- African Politics
- Asian Politics
- Chinese Politics
- Comparative Politics
- Conflict Politics
- Elections and Electoral Studies
- Environmental Politics
- European Union
- Foreign Policy
- Gender and Politics
- Human Rights and Politics
- Indian Politics
- International Relations
- International Organization (Politics)
- International Political Economy
- Irish Politics
- Latin American Politics
- Middle Eastern Politics
- Political Behaviour
- Political Economy
- Political Institutions
- Political Methodology
- Political Communication
- Political Philosophy
- Political Sociology
- Political Theory
- Politics and Law
- Public Policy
- Public Administration
- Quantitative Political Methodology
- Regional Political Studies
- Russian Politics
- Security Studies
- State and Local Government
- UK Politics
- US Politics
- Browse content in Regional and Area Studies
- African Studies
- Asian Studies
- East Asian Studies
- Japanese Studies
- Latin American Studies
- Middle Eastern Studies
- Native American Studies
- Scottish Studies
- Browse content in Research and Information
- Research Methods
- Browse content in Social Work
- Addictions and Substance Misuse
- Adoption and Fostering
- Care of the Elderly
- Child and Adolescent Social Work
- Couple and Family Social Work
- Developmental and Physical Disabilities Social Work
- Direct Practice and Clinical Social Work
- Emergency Services
- Human Behaviour and the Social Environment
- International and Global Issues in Social Work
- Mental and Behavioural Health
- Social Justice and Human Rights
- Social Policy and Advocacy
- Social Work and Crime and Justice
- Social Work Macro Practice
- Social Work Practice Settings
- Social Work Research and Evidence-based Practice
- Welfare and Benefit Systems
- Browse content in Sociology
- Childhood Studies
- Community Development
- Comparative and Historical Sociology
- Economic Sociology
- Gender and Sexuality
- Gerontology and Ageing
- Health, Illness, and Medicine
- Marriage and the Family
- Migration Studies
- Occupations, Professions, and Work
- Organizations
- Population and Demography
- Race and Ethnicity
- Social Theory
- Social Movements and Social Change
- Social Research and Statistics
- Social Stratification, Inequality, and Mobility
- Sociology of Religion
- Sociology of Education
- Sport and Leisure
- Urban and Rural Studies
- Browse content in Warfare and Defence
- Defence Strategy, Planning, and Research
- Land Forces and Warfare
- Military Administration
- Military Life and Institutions
- Naval Forces and Warfare
- Other Warfare and Defence Issues
- Peace Studies and Conflict Resolution
- Weapons and Equipment

- < Previous chapter
- Next chapter >

6 Statistical Conclusion Validity
- Published: May 2017
- Cite Icon Cite
- Permissions Icon Permissions
Chapter 6 addresses the sub-category of internal validity defined by Shadish et al., as statistical conclusion validity, or “validity of inferences about the correlation (covariance) between treatment and outcome.” The common threats to statistical conclusion validity can arise, or become plausible through either model misspecification or through hypothesis testing. The risk of a serious model misspecification is inversely proportional to the length of the time series, for example, and so is the risk of mistating the Type I and Type II error rates. Threats to statistical conclusion validity arise from the classical and modern hybrid significance testing structures, the serious threats that weigh heavily in p-value tests are shown to be undefined in Beyesian tests. While the particularly vexing threats raised by modern null hypothesis testing are resolved through the elimination of the modern null hypothesis test, threats to statistical conclusion validity would inevitably persist and new threats would arise.
Signed in as
Institutional accounts.
- Google Scholar Indexing
- GoogleCrawler [DO NOT DELETE]
Personal account
- Sign in with email/username & password
- Get email alerts
- Save searches
- Purchase content
- Activate your purchase/trial code
Institutional access
- Sign in with a library card Sign in with username/password Recommend to your librarian
- Institutional account management
- Get help with access
Access to content on Oxford Academic is often provided through institutional subscriptions and purchases. If you are a member of an institution with an active account, you may be able to access content in one of the following ways:
IP based access
Typically, access is provided across an institutional network to a range of IP addresses. This authentication occurs automatically, and it is not possible to sign out of an IP authenticated account.
Sign in through your institution
Choose this option to get remote access when outside your institution. Shibboleth/Open Athens technology is used to provide single sign-on between your institution’s website and Oxford Academic.
- Click Sign in through your institution.
- Select your institution from the list provided, which will take you to your institution's website to sign in.
- When on the institution site, please use the credentials provided by your institution. Do not use an Oxford Academic personal account.
- Following successful sign in, you will be returned to Oxford Academic.
If your institution is not listed or you cannot sign in to your institution’s website, please contact your librarian or administrator.
Sign in with a library card
Enter your library card number to sign in. If you cannot sign in, please contact your librarian.
Society Members
Society member access to a journal is achieved in one of the following ways:
Sign in through society site
Many societies offer single sign-on between the society website and Oxford Academic. If you see ‘Sign in through society site’ in the sign in pane within a journal:
- Click Sign in through society site.
- When on the society site, please use the credentials provided by that society. Do not use an Oxford Academic personal account.
If you do not have a society account or have forgotten your username or password, please contact your society.
Sign in using a personal account
Some societies use Oxford Academic personal accounts to provide access to their members. See below.
A personal account can be used to get email alerts, save searches, purchase content, and activate subscriptions.
Some societies use Oxford Academic personal accounts to provide access to their members.
Viewing your signed in accounts
Click the account icon in the top right to:
- View your signed in personal account and access account management features.
- View the institutional accounts that are providing access.
Signed in but can't access content
Oxford Academic is home to a wide variety of products. The institutional subscription may not cover the content that you are trying to access. If you believe you should have access to that content, please contact your librarian.
For librarians and administrators, your personal account also provides access to institutional account management. Here you will find options to view and activate subscriptions, manage institutional settings and access options, access usage statistics, and more.
Our books are available by subscription or purchase to libraries and institutions.
- About Oxford Academic
- Publish journals with us
- University press partners
- What we publish
- New features
- Open access
- Rights and permissions
- Accessibility
- Advertising
- Media enquiries
- Oxford University Press
- Oxford Languages
- University of Oxford
Oxford University Press is a department of the University of Oxford. It furthers the University's objective of excellence in research, scholarship, and education by publishing worldwide
- Copyright © 2024 Oxford University Press
- Cookie settings
- Cookie policy
- Privacy policy
- Legal notice
This Feature Is Available To Subscribers Only
Sign In or Create an Account
This PDF is available to Subscribers Only
For full access to this pdf, sign in to an existing account, or purchase an annual subscription.
Statistical conclusion validity: some common threats and simple remedies
Affiliation.
- 1 Facultad de Psicología, Departamento de Metodología, Universidad Complutense Madrid, Spain.
- PMID: 22952465
- PMCID: PMC3429930
- DOI: 10.3389/fpsyg.2012.00325
The ultimate goal of research is to produce dependable knowledge or to provide the evidence that may guide practical decisions. Statistical conclusion validity (SCV) holds when the conclusions of a research study are founded on an adequate analysis of the data, generally meaning that adequate statistical methods are used whose small-sample behavior is accurate, besides being logically capable of providing an answer to the research question. Compared to the three other traditional aspects of research validity (external validity, internal validity, and construct validity), interest in SCV has recently grown on evidence that inadequate data analyses are sometimes carried out which yield conclusions that a proper analysis of the data would not have supported. This paper discusses evidence of three common threats to SCV that arise from widespread recommendations or practices in data analysis, namely, the use of repeated testing and optional stopping without control of Type-I error rates, the recommendation to check the assumptions of statistical tests, and the use of regression whenever a bivariate relation or the equivalence between two variables is studied. For each of these threats, examples are presented and alternative practices that safeguard SCV are discussed. Educational and editorial changes that may improve the SCV of published research are also discussed.
Keywords: data analysis; preliminary tests; regression; stopping rules; validity of research.
- Privacy Policy
Buy Me a Coffee
Home » Validity – Types, Examples and Guide
Validity – Types, Examples and Guide
Table of Contents

Definition:
Validity refers to the extent to which a concept, measure, or study accurately represents the intended meaning or reality it is intended to capture. It is a fundamental concept in research and assessment that assesses the soundness and appropriateness of the conclusions, inferences, or interpretations made based on the data or evidence collected.
Research Validity
Research validity refers to the degree to which a study accurately measures or reflects what it claims to measure. In other words, research validity concerns whether the conclusions drawn from a study are based on accurate, reliable and relevant data.
Validity is a concept used in logic and research methodology to assess the strength of an argument or the quality of a research study. It refers to the extent to which a conclusion or result is supported by evidence and reasoning.
How to Ensure Validity in Research
Ensuring validity in research involves several steps and considerations throughout the research process. Here are some key strategies to help maintain research validity:
Clearly Define Research Objectives and Questions
Start by clearly defining your research objectives and formulating specific research questions. This helps focus your study and ensures that you are addressing relevant and meaningful research topics.
Use appropriate research design
Select a research design that aligns with your research objectives and questions. Different types of studies, such as experimental, observational, qualitative, or quantitative, have specific strengths and limitations. Choose the design that best suits your research goals.
Use reliable and valid measurement instruments
If you are measuring variables or constructs, ensure that the measurement instruments you use are reliable and valid. This involves using established and well-tested tools or developing your own instruments through rigorous validation processes.
Ensure a representative sample
When selecting participants or subjects for your study, aim for a sample that is representative of the population you want to generalize to. Consider factors such as age, gender, socioeconomic status, and other relevant demographics to ensure your findings can be generalized appropriately.
Address potential confounding factors
Identify potential confounding variables or biases that could impact your results. Implement strategies such as randomization, matching, or statistical control to minimize the influence of confounding factors and increase internal validity.
Minimize measurement and response biases
Be aware of measurement biases and response biases that can occur during data collection. Use standardized protocols, clear instructions, and trained data collectors to minimize these biases. Employ techniques like blinding or double-blinding in experimental studies to reduce bias.
Conduct appropriate statistical analyses
Ensure that the statistical analyses you employ are appropriate for your research design and data type. Select statistical tests that are relevant to your research questions and use robust analytical techniques to draw accurate conclusions from your data.
Consider external validity
While it may not always be possible to achieve high external validity, be mindful of the generalizability of your findings. Clearly describe your sample and study context to help readers understand the scope and limitations of your research.
Peer review and replication
Submit your research for peer review by experts in your field. Peer review helps identify potential flaws, biases, or methodological issues that can impact validity. Additionally, encourage replication studies by other researchers to validate your findings and enhance the overall reliability of the research.
Transparent reporting
Clearly and transparently report your research methods, procedures, data collection, and analysis techniques. Provide sufficient details for others to evaluate the validity of your study and replicate your work if needed.
Types of Validity
There are several types of validity that researchers consider when designing and evaluating studies. Here are some common types of validity:
Internal Validity
Internal validity relates to the degree to which a study accurately identifies causal relationships between variables. It addresses whether the observed effects can be attributed to the manipulated independent variable rather than confounding factors. Threats to internal validity include selection bias, history effects, maturation of participants, and instrumentation issues.
External Validity
External validity concerns the generalizability of research findings to the broader population or real-world settings. It assesses the extent to which the results can be applied to other individuals, contexts, or timeframes. Factors that can limit external validity include sample characteristics, research settings, and the specific conditions under which the study was conducted.
Construct Validity
Construct validity examines whether a study adequately measures the intended theoretical constructs or concepts. It focuses on the alignment between the operational definitions used in the study and the underlying theoretical constructs. Construct validity can be threatened by issues such as poor measurement tools, inadequate operational definitions, or a lack of clarity in the conceptual framework.
Content Validity
Content validity refers to the degree to which a measurement instrument or test adequately covers the entire range of the construct being measured. It assesses whether the items or questions included in the measurement tool represent the full scope of the construct. Content validity is often evaluated through expert judgment, reviewing the relevance and representativeness of the items.
Criterion Validity
Criterion validity determines the extent to which a measure or test is related to an external criterion or standard. It assesses whether the results obtained from a measurement instrument align with other established measures or outcomes. Criterion validity can be divided into two subtypes: concurrent validity, which examines the relationship between the measure and the criterion at the same time, and predictive validity, which investigates the measure’s ability to predict future outcomes.
Face Validity
Face validity refers to the degree to which a measurement or test appears, on the surface, to measure what it intends to measure. It is a subjective assessment based on whether the items seem relevant and appropriate to the construct being measured. Face validity is often used as an initial evaluation before conducting more rigorous validity assessments.
Importance of Validity
Validity is crucial in research for several reasons:
- Accurate Measurement: Validity ensures that the measurements or observations in a study accurately represent the intended constructs or variables. Without validity, researchers cannot be confident that their results truly reflect the phenomena they are studying. Validity allows researchers to draw accurate conclusions and make meaningful inferences based on their findings.
- Credibility and Trustworthiness: Validity enhances the credibility and trustworthiness of research. When a study demonstrates high validity, it indicates that the researchers have taken appropriate measures to ensure the accuracy and integrity of their work. This strengthens the confidence of other researchers, peers, and the wider scientific community in the study’s results and conclusions.
- Generalizability: Validity helps determine the extent to which research findings can be generalized beyond the specific sample and context of the study. By addressing external validity, researchers can assess whether their results can be applied to other populations, settings, or situations. This information is valuable for making informed decisions, implementing interventions, or developing policies based on research findings.
- Sound Decision-Making: Validity supports informed decision-making in various fields, such as medicine, psychology, education, and social sciences. When validity is established, policymakers, practitioners, and professionals can rely on research findings to guide their actions and interventions. Validity ensures that decisions are based on accurate and trustworthy information, which can lead to better outcomes and more effective practices.
- Avoiding Errors and Bias: Validity helps researchers identify and mitigate potential errors and biases in their studies. By addressing internal validity, researchers can minimize confounding factors and alternative explanations, ensuring that the observed effects are genuinely attributable to the manipulated variables. Validity assessments also highlight measurement errors or shortcomings, enabling researchers to improve their measurement tools and procedures.
- Progress of Scientific Knowledge: Validity is essential for the advancement of scientific knowledge. Valid research contributes to the accumulation of reliable and valid evidence, which forms the foundation for building theories, developing models, and refining existing knowledge. Validity allows researchers to build upon previous findings, replicate studies, and establish a cumulative body of knowledge in various disciplines. Without validity, the scientific community would struggle to make meaningful progress and establish a solid understanding of the phenomena under investigation.
- Ethical Considerations: Validity is closely linked to ethical considerations in research. Conducting valid research ensures that participants’ time, effort, and data are not wasted on flawed or invalid studies. It upholds the principle of respect for participants’ autonomy and promotes responsible research practices. Validity is also important when making claims or drawing conclusions that may have real-world implications, as misleading or invalid findings can have adverse effects on individuals, organizations, or society as a whole.
Examples of Validity
Here are some examples of validity in different contexts:
- Example 1: All men are mortal. John is a man. Therefore, John is mortal. This argument is logically valid because the conclusion follows logically from the premises.
- Example 2: If it is raining, then the ground is wet. The ground is wet. Therefore, it is raining. This argument is not logically valid because there could be other reasons for the ground being wet, such as watering the plants.
- Example 1: In a study examining the relationship between caffeine consumption and alertness, the researchers use established measures of both variables, ensuring that they are accurately capturing the concepts they intend to measure. This demonstrates construct validity.
- Example 2: A researcher develops a new questionnaire to measure anxiety levels. They administer the questionnaire to a group of participants and find that it correlates highly with other established anxiety measures. This indicates good construct validity for the new questionnaire.
- Example 1: A study on the effects of a particular teaching method is conducted in a controlled laboratory setting. The findings of the study may lack external validity because the conditions in the lab may not accurately reflect real-world classroom settings.
- Example 2: A research study on the effects of a new medication includes participants from diverse backgrounds and age groups, increasing the external validity of the findings to a broader population.
- Example 1: In an experiment, a researcher manipulates the independent variable (e.g., a new drug) and controls for other variables to ensure that any observed effects on the dependent variable (e.g., symptom reduction) are indeed due to the manipulation. This establishes internal validity.
- Example 2: A researcher conducts a study examining the relationship between exercise and mood by administering questionnaires to participants. However, the study lacks internal validity because it does not control for other potential factors that could influence mood, such as diet or stress levels.
- Example 1: A teacher develops a new test to assess students’ knowledge of a particular subject. The items on the test appear to be relevant to the topic at hand and align with what one would expect to find on such a test. This suggests face validity, as the test appears to measure what it intends to measure.
- Example 2: A company develops a new customer satisfaction survey. The questions included in the survey seem to address key aspects of the customer experience and capture the relevant information. This indicates face validity, as the survey seems appropriate for assessing customer satisfaction.
- Example 1: A team of experts reviews a comprehensive curriculum for a high school biology course. They evaluate the curriculum to ensure that it covers all the essential topics and concepts necessary for students to gain a thorough understanding of biology. This demonstrates content validity, as the curriculum is representative of the domain it intends to cover.
- Example 2: A researcher develops a questionnaire to assess career satisfaction. The questions in the questionnaire encompass various dimensions of job satisfaction, such as salary, work-life balance, and career growth. This indicates content validity, as the questionnaire adequately represents the different aspects of career satisfaction.
- Example 1: A company wants to evaluate the effectiveness of a new employee selection test. They administer the test to a group of job applicants and later assess the job performance of those who were hired. If there is a strong correlation between the test scores and subsequent job performance, it suggests criterion validity, indicating that the test is predictive of job success.
- Example 2: A researcher wants to determine if a new medical diagnostic tool accurately identifies a specific disease. They compare the results of the diagnostic tool with the gold standard diagnostic method and find a high level of agreement. This demonstrates criterion validity, indicating that the new tool is valid in accurately diagnosing the disease.
Where to Write About Validity in A Thesis
In a thesis, discussions related to validity are typically included in the methodology and results sections. Here are some specific places where you can address validity within your thesis:
Research Design and Methodology
In the methodology section, provide a clear and detailed description of the measures, instruments, or data collection methods used in your study. Discuss the steps taken to establish or assess the validity of these measures. Explain the rationale behind the selection of specific validity types relevant to your study, such as content validity, criterion validity, or construct validity. Discuss any modifications or adaptations made to existing measures and their potential impact on validity.
Measurement Procedures
In the methodology section, elaborate on the procedures implemented to ensure the validity of measurements. Describe how potential biases or confounding factors were addressed, controlled, or accounted for to enhance internal validity. Provide details on how you ensured that the measurement process accurately captures the intended constructs or variables of interest.
Data Collection
In the methodology section, discuss the steps taken to collect data and ensure data validity. Explain any measures implemented to minimize errors or biases during data collection, such as training of data collectors, standardized protocols, or quality control procedures. Address any potential limitations or threats to validity related to the data collection process.
Data Analysis and Results
In the results section, present the analysis and findings related to validity. Report any statistical tests, correlations, or other measures used to assess validity. Provide interpretations and explanations of the results obtained. Discuss the implications of the validity findings for the overall reliability and credibility of your study.
Limitations and Future Directions
In the discussion or conclusion section, reflect on the limitations of your study, including limitations related to validity. Acknowledge any potential threats or weaknesses to validity that you encountered during your research. Discuss how these limitations may have influenced the interpretation of your findings and suggest avenues for future research that could address these validity concerns.
Applications of Validity
Validity is applicable in various areas and contexts where research and measurement play a role. Here are some common applications of validity:
Psychological and Behavioral Research
Validity is crucial in psychology and behavioral research to ensure that measurement instruments accurately capture constructs such as personality traits, intelligence, attitudes, emotions, or psychological disorders. Validity assessments help researchers determine if their measures are truly measuring the intended psychological constructs and if the results can be generalized to broader populations or real-world settings.
Educational Assessment
Validity is essential in educational assessment to determine if tests, exams, or assessments accurately measure students’ knowledge, skills, or abilities. It ensures that the assessment aligns with the educational objectives and provides reliable information about student performance. Validity assessments help identify if the assessment is valid for all students, regardless of their demographic characteristics, language proficiency, or cultural background.
Program Evaluation
Validity plays a crucial role in program evaluation, where researchers assess the effectiveness and impact of interventions, policies, or programs. By establishing validity, evaluators can determine if the observed outcomes are genuinely attributable to the program being evaluated rather than extraneous factors. Validity assessments also help ensure that the evaluation findings are applicable to different populations, contexts, or timeframes.
Medical and Health Research
Validity is essential in medical and health research to ensure the accuracy and reliability of diagnostic tools, measurement instruments, and clinical assessments. Validity assessments help determine if a measurement accurately identifies the presence or absence of a medical condition, measures the effectiveness of a treatment, or predicts patient outcomes. Validity is crucial for establishing evidence-based medicine and informing medical decision-making.
Social Science Research
Validity is relevant in various social science disciplines, including sociology, anthropology, economics, and political science. Researchers use validity to ensure that their measures and methods accurately capture social phenomena, such as social attitudes, behaviors, social structures, or economic indicators. Validity assessments support the reliability and credibility of social science research findings.
Market Research and Surveys
Validity is important in market research and survey studies to ensure that the survey questions effectively measure consumer preferences, buying behaviors, or attitudes towards products or services. Validity assessments help researchers determine if the survey instrument is accurately capturing the desired information and if the results can be generalized to the target population.
Limitations of Validity
Here are some limitations of validity:
- Construct Validity: Limitations of construct validity include the potential for measurement error, inadequate operational definitions of constructs, or the failure to capture all aspects of a complex construct.
- Internal Validity: Limitations of internal validity may arise from confounding variables, selection bias, or the presence of extraneous factors that could influence the study outcomes, making it difficult to attribute causality accurately.
- External Validity: Limitations of external validity can occur when the study sample does not represent the broader population, when the research setting differs significantly from real-world conditions, or when the study lacks ecological validity, i.e., the findings do not reflect real-world complexities.
- Measurement Validity: Limitations of measurement validity can arise from measurement error, inadequately designed or flawed measurement scales, or limitations inherent in self-report measures, such as social desirability bias or recall bias.
- Statistical Conclusion Validity: Limitations in statistical conclusion validity can occur due to sampling errors, inadequate sample sizes, or improper statistical analysis techniques, leading to incorrect conclusions or generalizations.
- Temporal Validity: Limitations of temporal validity arise when the study results become outdated due to changes in the studied phenomena, interventions, or contextual factors.
- Researcher Bias: Researcher bias can affect the validity of a study. Biases can emerge through the researcher’s subjective interpretation, influence of personal beliefs, or preconceived notions, leading to unintentional distortion of findings or failure to consider alternative explanations.
- Ethical Validity: Limitations can arise if the study design or methods involve ethical concerns, such as the use of deceptive practices, inadequate informed consent, or potential harm to participants.
Also see Reliability Vs Validity
About the author

Muhammad Hassan
Researcher, Academic Writer, Web developer
You may also like

Alternate Forms Reliability – Methods, Examples...

Construct Validity – Types, Threats and Examples

Internal Validity – Threats, Examples and Guide

Reliability Vs Validity

Internal Consistency Reliability – Methods...

Split-Half Reliability – Methods, Examples and...
- Foundations
- Write Paper
Search form
- Experiments
- Anthropology
- Self-Esteem
- Social Anxiety
- Statistics >
Statistical Validity
Statistical validity refers to whether a statistical study is able to draw conclusions that are in agreement with statistical and scientific laws. This means if a conclusion is drawn from a given data set after experimentation, it is said to be scientifically valid if the conclusion drawn from the experiment is scientific and relies on mathematical and statistical laws.
This article is a part of the guide:
- Significance 2
- Sample Size
- Experimental Probability
- Cronbach’s Alpha
- Systematic Error
Browse Full Outline
- 1 Inferential Statistics
- 2.1 Bayesian Probability
- 3.1.1 Significance 2
- 3.2 Significant Results
- 3.3 Sample Size
- 3.4 Margin of Error
- 3.5.1 Random Error
- 3.5.2 Systematic Error
- 3.5.3 Data Dredging
- 3.5.4 Ad Hoc Analysis
- 3.5.5 Regression Toward the Mean
- 4.1 P-Value
- 4.2 Effect Size
- 5.1 Philosophy of Statistics
- 6.1.1 Reliability 2
- 6.2 Cronbach’s Alpha
There are different kinds of statistical validities that are relevant to research and experimentation. Each of these is important in order for the experiment to give accurate predictions and draw valid conclusions. Some of these are:
- Convergent validity - this validity ensures that if the required theory predicts that one measure be correlated with the other, then the statistics confirm this.
- Divergent or Discriminant validity - this validity ensures that if the required theory predicts that one variable doesn't correlate with others, then statistics need to conform this.
- Content validity : This type of validity is important to make sure that the test or questionnaire that is prepared actually covers all aspects of the variable that is being studied. If the test is too narrow, then it will not predict what it claims.
- Face validity : This is related to content validity and is a quick starting estimate of whether the given experiment actually mimics the claims that are being verified. In other words, face validity measures whether or not the survey has the right questions in order to answer the research questions that it aims to answer.
- Conclusion validity: this type of validity ensures that the conclusion that is being reached from the data sets obtained from the experiment are actually right and justified. For example, the sample size should be large enough to predict any meaningful relationships between the variables being studied. If not, then conclusion validity is being violated.
- Internal validity : internal validity is a measure of the inherent relationship between cause and effect that are being studied in the experiment. For example, the controls used in the experiment must be meaningful and strict if the effect of one variable is being studied on another.
- External validity : external validity is all about how to apply the results from this particular experiment to more general populations . External validity tells us whether or not we can generalize the results of this experiment to all other populations or to some populations with particular characteristics.
These are the main types of statistical validity that one needs to consider during research and experimentation.
- Psychology 101
- Flags and Countries
- Capitals and Countries
Siddharth Kalla (Jun 3, 2010). Statistical Validity. Retrieved Apr 21, 2024 from Explorable.com: https://explorable.com/statistical-validity
You Are Allowed To Copy The Text
The text in this article is licensed under the Creative Commons-License Attribution 4.0 International (CC BY 4.0) .
This means you're free to copy, share and adapt any parts (or all) of the text in the article, as long as you give appropriate credit and provide a link/reference to this page.
That is it. You don't need our permission to copy the article; just include a link/reference back to this page. You can use it freely (with some kind of link), and we're also okay with people reprinting in publications like books, blogs, newsletters, course-material, papers, wikipedia and presentations (with clear attribution).

Want to stay up to date? Follow us!
Save this course for later.
Don't have time for it all now? No problem, save it as a course and come back to it later.
Footer bottom
- Privacy Policy

- Subscribe to our RSS Feed
- Like us on Facebook
- Follow us on Twitter

- school Campus Bookshelves
- menu_book Bookshelves
- perm_media Learning Objects
- login Login
- how_to_reg Request Instructor Account
- hub Instructor Commons
- Download Page (PDF)
- Download Full Book (PDF)
- Periodic Table
- Physics Constants
- Scientific Calculator
- Reference & Cite
- Tools expand_more
- Readability
selected template will load here
This action is not available.
5.1: Key Attributes of a Research Design
- Last updated
- Save as PDF
- Page ID 26232

- Anol Bhattacherjee
- University of South Florida via Global Text Project
The quality of research designs can be defined in terms of four key design attributes: internal validity, external validity, construct validity, and statistical conclusion validity.
Internal validity , also called causality, examines whether the observed change in a dependent variable is indeed caused by a corresponding change in hypothesized independent variable, and not by variables extraneous to the research context. Causality requires three conditions: (1) covariation of cause and effect (i.e., if cause happens, then effect also happens; and if cause does not happen, effect does not happen), (2) temporal precedence: cause must precede effect in time, (3) no plausible alternative explanation (or spurious correlation). Certain research designs, such as laboratory experiments, are strong in internal validity by virtue of their ability to manipulate the independent variable (cause) via a treatment and observe the effect (dependent variable) of that treatment after a certain point in time, while controlling for the effects of extraneous variables. Other designs, such as field surveys, are poor in internal validity because of their inability to manipulate the independent variable (cause), and because cause and effect are measured at the same point in time which defeats temporal precedence making it equally likely that the expected effect might have influenced the expected cause rather than the reverse. Although higher in internal validity compared to other methods, laboratory experiments are, by no means, immune to threats of internal validity, and are susceptible to history, testing, instrumentation, regression, and other threats that are discussed later in the chapter on experimental designs. Nonetheless, different research designs vary considerably in their respective level of internal validity.
External validity or generalizability refers to whether the observed associations can be generalized from the sample to the population (population validity), or to other people, organizations, contexts, or time (ecological validity). For instance, can results drawn from a sample of financial firms in the United States be generalized to the population of financial firms (population validity) or to other firms within the United States (ecological validity)? Survey research, where data is sourced from a wide variety of individuals, firms, or other units of analysis, tends to have broader generalizability than laboratory experiments where artificially contrived treatments and strong control over extraneous variables render the findings less generalizable to real-life settings where treatments and extraneous variables cannot be controlled. The variation in internal and external validity for a wide range of research designs are shown in Figure 5.1.

Some researchers claim that there is a tradeoff between internal and external validity: higher external validity can come only at the cost of internal validity and vice-versa. But this is not always the case. Research designs such as field experiments, longitudinal field surveys, and multiple case studies have higher degrees of both internal and external validities. Personally, I prefer research designs that have reasonable degrees of both internal and external validities, i.e., those that fall within the cone of validity shown in Figure 5.1. But this should not suggest that designs outside this cone are any less useful or valuable. Researchers’ choice of designs is ultimately a matter of their personal preference and competence, and the level of internal and external validity they desire.
Construct validity examines how well a given measurement scale is measuring the theoretical construct that it is expected to measure. Many constructs used in social science research such as empathy, resistance to change, and organizational learning are difficult to define, much less measure. For instance, construct validity must assure that a measure of empathy is indeed measuring empathy and not compassion, which may be difficult since these constructs are somewhat similar in meaning. Construct validity is assessed in positivist research based on correlational or factor analysis of pilot test data, as described in the next chapter.
Statistical conclusion validity examines the extent to which conclusions derived using a statistical procedure is valid. For example, it examines whether the right statistical method was used for hypotheses testing, whether the variables used meet the assumptions of that statistical test (such as sample size or distributional requirements), and so forth. Because interpretive research designs do not employ statistical test, statistical conclusion validity is not applicable for such analysis. The different kinds of validity and where they exist at the theoretical/empirical levels are illustrated in Figure 5.2.

ORIGINAL RESEARCH article
Statistical conclusion validity: some common threats and simple remedies.

- Facultad de Psicología, Departamento de Metodología, Universidad Complutense, Madrid, Spain
The ultimate goal of research is to produce dependable knowledge or to provide the evidence that may guide practical decisions. Statistical conclusion validity (SCV) holds when the conclusions of a research study are founded on an adequate analysis of the data, generally meaning that adequate statistical methods are used whose small-sample behavior is accurate, besides being logically capable of providing an answer to the research question. Compared to the three other traditional aspects of research validity (external validity, internal validity, and construct validity), interest in SCV has recently grown on evidence that inadequate data analyses are sometimes carried out which yield conclusions that a proper analysis of the data would not have supported. This paper discusses evidence of three common threats to SCV that arise from widespread recommendations or practices in data analysis, namely, the use of repeated testing and optional stopping without control of Type-I error rates, the recommendation to check the assumptions of statistical tests, and the use of regression whenever a bivariate relation or the equivalence between two variables is studied. For each of these threats, examples are presented and alternative practices that safeguard SCV are discussed. Educational and editorial changes that may improve the SCV of published research are also discussed.
Psychologists are well aware of the traditional aspects of research validity introduced by Campbell and Stanley (1966) and further subdivided and discussed by Cook and Campbell (1979) . Despite initial criticisms of the practically oriented and somewhat fuzzy distinctions among the various aspects (see Cook and Campbell, 1979 , pp. 85–91; see also Shadish et al., 2002 , pp. 462–484), the four facets of research validity have gained recognition and they are currently covered in many textbooks on research methods in psychology (e.g., Beins, 2009 ; Goodwin, 2010 ; Girden and Kabacoff, 2011 ). Methods and strategies aimed at securing research validity are also discussed in these and other sources. To simplify the description, construct validity is sought by using well-established definitions and measurement procedures for variables, internal validity is sought by ensuring that extraneous variables have been controlled and confounds have been eliminated, and external validity is sought by observing and measuring dependent variables under natural conditions or under an appropriate representation of them. The fourth aspect of research validity, which Cook and Campbell called statistical conclusion validity (SCV), is the subject of this paper.
Cook and Campbell, 1979 , pp. 39–50) discussed that SCV pertains to the extent to which data from a research study can reasonably be regarded as revealing a link (or lack thereof) between independent and dependent variables as far as statistical issues are concerned . This particular facet was separated from other factors acting in the same direction (the three other facets of validity) and includes three aspects: (1) whether the study has enough statistical power to detect an effect if it exists, (2) whether there is a risk that the study will “reveal” an effect that does not actually exist, and (3) how can the magnitude of the effect be confidently estimated. They nevertheless considered the latter aspect as a mere step ahead once the first two aspects had been satisfactorily solved, and they summarized their position by stating that SCV “refers to inferences about whether it is reasonable to presume covariation given a specified α level and the obtained variances” ( Cook and Campbell, 1979 , p. 41). Given that mentioning “the obtained variances” was an indirect reference to statistical power and mentioning α was a direct reference to statistical significance, their position about SCV may have seemed to only entail consideration that the statistical decision can be incorrect as a result of Type-I and Type-II errors. Perhaps as a consequence of this literal interpretation, review papers studying SCV in published research have focused on power and significance (e.g., Ottenbacher, 1989 ; Ottenbacher and Maas, 1999 ), strategies aimed at increasing SCV have only considered these issues (e.g., Howard et al., 1983 ), and tutorials on the topic only or almost only mention these issues along with effect sizes (e.g., Orme, 1991 ; Austin et al., 1998 ; Rankupalli and Tandon, 2010 ). This emphasis on issues of significance and power may also be the reason that some sources refer to threats to SCV as “any factor that leads to a Type-I or a Type-II error” (e.g., Girden and Kabacoff, 2011 , p. 6; see also Rankupalli and Tandon, 2010 , Section 1.2), as if these errors had identifiable causes that could be prevented. It should be noted that SCV has also occasionally been purported to reflect the extent to which pre-experimental designs provide evidence for causation ( Lee, 1985 ) or the extent to which meta-analyses are based on representative results that make the conclusion generalizable ( Elvik, 1998 ).
But Cook and Campbell’s (1979 , p. 80) aim was undoubtedly broader, as they stressed that SCV “is concerned with sources of random error and with the appropriate use of statistics and statistical tests ” (italics added). Moreover, Type-I and Type-II errors are an essential and inescapable consequence of the statistical decision theory underlying significance testing and, as such, the potential occurrence of one or the other of these errors cannot be prevented. The actual occurrence of them for the data on hand cannot be assessed either. Type-I and Type-II errors will always be with us and, hence, SCV is only trivially linked to the fact that research will never unequivocally prove or reject any statistical null hypothesis or its originating research hypothesis. Cook and Campbell seemed to be well aware of this issue when they stressed that SCV refers to reasonable inferences given a specified significance level and a given power. In addition, Stevens (1950 , p. 121) forcefully emphasized that “ it is a statistician’s duty to be wrong the stated number of times,” implying that a researcher should accept the assumed risks of Type-I and Type-II errors, use statistical methods that guarantee the assumed error rates, and consider these as an essential part of the research process. From this position, these errors do not affect SCV unless their probability differs meaningfully from that which was assumed. And this is where an alternative perspective on SCV enters the stage, namely, whether the data were analyzed properly so as to extract conclusions that faithfully reflect what the data have to say about the research question. A negative answer raises concerns about SCV beyond the triviality of Type-I or Type-II errors. There are actually two types of threat to SCV from this perspective. One is when the data are subjected to thoroughly inadequate statistical analyses that do not match the characteristics of the design used to collect the data or that cannot logically give an answer to the research question. The other is when a proper statistical test is used but it is applied under conditions that alter the stated risk probabilities. In the former case, the conclusion will be wrong except by accident; in the latter, the conclusion will fail to be incorrect with the declared probabilities of Type-I and Type-II errors.
The position elaborated in the foregoing paragraph is well summarized in Milligan and McFillen’s (1984 , p. 439) statement that “under normal conditions (…) the researcher will not know when a null effect has been declared significant or when a valid effect has gone undetected (…) Unfortunately, the statistical conclusion validity, and the ultimate value of the research, rests on the explicit control of (Type-I and Type-II) error rates.” This perspective on SCV is explicitly discussed in some textbooks on research methods (e.g., Beins, 2009 , pp. 139–140; Goodwin, 2010 , pp. 184–185) and some literature reviews have been published that reveal a sound failure of SCV in these respects.
For instance, Milligan and McFillen’s (1984 , p. 438) reviewed evidence that “the business research community has succeeded in publishing a great deal of incorrect and statistically inadequate research” and they dissected and discussed in detail four additional cases (among many others that reportedly could have been chosen) in which a breach of SCV resulted from gross mismatches between the research design and the statistical analysis. Similarly, García-Pérez (2005) reviewed alternative methods to compute confidence intervals for proportions and discussed three papers (among many others that reportedly could have been chosen) in which inadequate confidence intervals had been computed. More recently, Bakker and Wicherts (2011) conducted a thorough analysis of psychological papers and estimated that roughly 50% of published papers contain reporting errors, although they only checked whether the reported p value was correct and not whether the statistical test used was appropriate. A similar analysis carried out by Nieuwenhuis et al. (2011) revealed that 50% of the papers reporting the results of a comparison of two experimental effects in top neuroscience journals had used an incorrect statistical procedure. And Bland and Altman (2011) reported further data on the prevalence of incorrect statistical analyses of a similar nature.
An additional indicator of the use of inadequate statistical procedures arises from consideration of published papers whose title explicitly refers to a re-analysis of data reported in some other paper. A literature search for papers including in their title the terms “a re-analysis,” “a reanalysis,” “re-analyses,” “reanalyses,” or “alternative analysis” was conducted on May 3, 2012 in the Web of Science (WoS; http://thomsonreuters.com ), which rendered 99 such papers with subject area “Psychology” published in 1990 or later. Although some of these were false positives, a sizeable number of them actually discussed the inadequacy of analyses carried out by the original authors and reported the results of proper alternative analyses that typically reversed the original conclusion. This type of outcome upon re-analyses of data are more frequent than the results of this quick and simple search suggest, because the information for identification is not always included in the title of the paper or is included in some other form: For a simple example, the search for the clause “a closer look” in the title rendered 131 papers, many of which also presented re-analyses of data that reversed the conclusion of the original study.
Poor design or poor sample size planning may, unbeknownst to the researcher, lead to unacceptable Type-II error rates, which will certainly affect SCV (as long as the null is not rejected; if it is, the probability of a Type-II error is irrelevant). Although insufficient power due to lack of proper planning has consequences on statistical tests, the thread of this paper de-emphasizes this aspect of SCV (which should perhaps more reasonably fit within an alternative category labeled design validity ) and emphasizes the idea that SCV holds when statistical conclusions are incorrect with the stated probabilities of Type-I and Type-II errors (whether the latter was planned or simply computed). Whether or not the actual significance level used in the research or the power that it had is judged acceptable is another issue, which does not affect SCV: The statistical conclusion is valid within the stated (or computed) error probabilities. A breach of SCV occurs, then, when the data are not subjected to adequate statistical analyses or when control of Type-I or Type-II errors is lost.
It should be noted that a further component was included into consideration of SCV in Shadish et al.’s (2002) sequel to Cook and Campbell’s (1979 ) book, namely, effect size. Effect size relates to what has been called a Type-III error ( Crawford et al., 1998 ), that is, a statistically significant result that has no meaningful practical implication and that only arises from the use of a huge sample. This issue is left aside in the present paper because adequate consideration and reporting of effect sizes precludes Type-III errors, although the recommendations of Wilkinson and The Task Force on Statistical Inference (1999) in this respect are not always followed. Consider, e.g., Lippa’s (2007) study of the relation between sex drive and sexual attraction. Correlations generally lower than 0.3 in absolute value were declared strong as a result of p values below 0.001. With sample sizes sometimes nearing 50,000 paired observations, even correlations valued at 0.04 turned out significant in this study. More attention to effect sizes is certainly needed, both by researchers and by journal editors and reviewers.
The remainder of this paper analyzes three common practices that result in SCV breaches, also discussing simple replacements for them.
Stopping Rules for Data Collection without Control of Type-I Error Rates
The asymptotic theory that provides justification for null hypothesis significance testing (NHST) assumes what is known as fixed sampling , which means that the size n of the sample is not itself a random variable or, in other words, that the size of the sample has been decided in advance and the statistical test is performed once the entire sample of data has been collected. Numerous procedures have been devised to determine the size that a sample must have according to planned power ( Ahn et al., 2001 ; Faul et al., 2007 ; Nisen and Schwertman, 2008 ; Jan and Shieh, 2011 ), the size of the effect sought to be detected ( Morse, 1999 ), or the width of the confidence intervals of interest ( Graybill, 1958 ; Boos and Hughes-Oliver, 2000 ; Shieh and Jan, 2012 ). For reviews, see Dell et al. (2002) and Maxwell et al. (2008) . In many cases, a researcher simply strives to gather as large a sample as possible. Asymptotic theory supports NHST under fixed sampling assumptions, whether or not the size of the sample was planned.
In contrast to fixed sampling, sequential sampling implies that the number of observations is not fixed in advance but depends by some rule on the observations already collected ( Wald, 1947 ; Anscombe, 1953 ; Wetherill, 1966 ). In practice, data are analyzed as they come in and data collection stops when the observations collected thus far satisfy some criterion. The use of sequential sampling faces two problems ( Anscombe, 1953 , p. 6): (i) devising a suitable stopping rule and (ii) finding a suitable test statistic and determining its sampling distribution. The mere statement of the second problem evidences that the sampling distribution of conventional test statistics for fixed sampling no longer holds under sequential sampling. These sampling distributions are relatively easy to derive in some cases, particularly in those involving negative binomial parameters ( Anscombe, 1953 ; García-Pérez and Núñez-Antón, 2009 ). The choice between fixed and sequential sampling (sometimes portrayed as the “experimenter’s intention”; see Wagenmakers, 2007 ) has important ramifications for NHST because the probability that the observed data are compatible (by any criterion) with a true null hypothesis generally differs greatly across sampling methods. This issue is usually bypassed by those who look at the data as a “sure fact” once collected, as if the sampling method used to collect the data did not make any difference or should not affect how the data are interpreted.
There are good reasons for using sequential sampling in psychological research. For instance, in clinical studies in which patients are recruited on the go, the experimenter may want to analyze data as they come in to be able to prevent the administration of a seemingly ineffective or even hurtful treatment to new patients. In studies involving a waiting-list control group, individuals in this group are generally transferred to an experimental group midway along the experiment. In studies with laboratory animals, the experimenter may want to stop testing animals before the planned number has been reached so that animals are not wasted when an effect (or the lack thereof) seems established. In these and analogous cases, the decision as to whether data will continue to be collected results from an analysis of the data collected thus far, typically using a statistical test that was devised for use in conditions of fixed sampling. In other cases, experimenters test their statistical hypothesis each time a new observation or block of observations is collected, and continue the experiment until they feel the data are conclusive one way or the other. Software has been developed that allows experimenters to find out how many more observations will be needed for a marginally non-significant result to become significant on the assumption that sample statistics will remain invariant when the extra data are collected ( Morse, 1998 ).
The practice of repeated testing and optional stopping has been shown to affect in unpredictable ways the empirical Type-I error rate of statistical tests designed for use under fixed sampling ( Anscombe, 1954 ; Armitage et al., 1969 ; McCarroll et al., 1992 ; Strube, 2006 ; Fitts, 2011a ). The same holds when a decision is made to collect further data on evidence of a marginally (non) significant result ( Shun et al., 2001 ; Chen et al., 2004 ). The inaccuracy of statistical tests in these conditions represents a breach of SCV, because the statistical conclusion thus fails to be incorrect with the assumed (and explicitly stated) probabilities of Type-I and Type-II errors. But there is an easy way around the inflation of Type-I error rates from within NHST, which solves the threat to SCV that repeated testing and optional stopping entail.
In what appears to be the first development of a sequential procedure with control of Type-I error rates in psychology, Frick (1998) proposed that repeated statistical testing be conducted under the so-called COAST (composite open adaptive sequential test) rule: If the test yields p < 0.01, stop collecting data and reject the null; if it yields p > 0.36, stop also and do not reject the null; otherwise, collect more data and re-test. The low criterion at 0.01 and the high criterion at 0.36 were selected through simulations so as to ensure a final Type-I error rate of 0.05 for paired-samples t tests. Use of the same low and high criteria rendered similar control of Type-I error rates for tests of the product-moment correlation, but they yielded slightly conservative tests of the interaction in 2 × 2 between-subjects ANOVAs. Frick also acknowledged that adjusting the low and high criteria might be needed in other cases, although he did not address them. This has nevertheless been done by others who have modified and extended Frick’s approach (e.g., Botella et al., 2006 ; Ximenez and Revuelta, 2007 ; Fitts, 2010a , b , 2011b ). The result is sequential procedures with stopping rules that guarantee accurate control of final Type-I error rates for the statistical tests that are more widely used in psychological research.
Yet, these methods do not seem to have ever been used in actual research, or at least their use has not been acknowledged. For instance, of the nine citations to Frick’s (1998) paper listed in WoS as of May 3, 2012, only one is from a paper (published in 2011) in which the COAST rule was reportedly used, although unintendedly. And not a single citation is to be found in WoS from papers reporting the use of the extensions and modifications of Botella et al. (2006) or Ximenez and Revuelta (2007) . Perhaps researchers in psychology invariably use fixed sampling, but it is hard to believe that “data peeking” or “data monitoring” was never used, or that the results of such interim analyses never led researchers to collect some more data. Wagenmakers (2007 , p. 785) regretted that “it is not clear what percentage of p values reported in experimental psychology have been contaminated by some form of optional stopping. There is simply no information in Results sections that allows one to assess the extent to which optional stopping has occurred.” This incertitude was quickly resolved by John et al. (2012) . They surveyed over 2000 psychologists with highly revealing results: Respondents affirmatively admitted to the practices of data peeking, data monitoring, or conditional stopping in rates that varied between 20 and 60%.
Besides John et al.’s (2012) proposal that authors disclose these details in full and Simmons et al.’s (2011) proposed list of requirements for authors and guidelines for reviewers, the solution to the problem is simple: Use strategies that control Type-I error rates upon repeated testing and optional stopping. These strategies have been widely used in biomedical research for decades ( Bauer and Köhne, 1994 ; Mehta and Pocock, 2011 ). There is no reason that psychological research should ignore them and give up efficient research with control of Type-I error rates, particularly when these strategies have also been adapted and further developed for use under the most common designs in psychological research ( Frick, 1998 ; Botella et al., 2006 ; Ximenez and Revuelta, 2007 ; Fitts, 2010a , b ).
It should also be stressed that not all instances of repeated testing or optional stopping without control of Type-I error rates threaten SCV. A breach of SCV occurs only when the conclusion regarding the research question is based on the use of these practices. For an acceptable use, consider the study of Xu et al. (2011) . They investigated order preferences in primates to find out whether primates preferred to receive the best item first rather than last. Their procedure involved several experiments and they declared that “three significant sessions (two-tailed binomial tests per session, p < 0.05) or 10 consecutive non-significant sessions were required from each monkey before moving to the next experiment. The three significant sessions were not necessarily consecutive (…) Ten consecutive non-significant sessions were taken to mean there was no preference by the monkey” (p. 2304). In this case, the use of repeated testing with optional stopping at a nominal 95% significance level for each individual test is part of the operational definition of an outcome variable used as a criterion to proceed to the next experiment. And, in any event, the overall probability of misclassifying a monkey according to this criterion is certainly fixed at a known value that can easily be worked out from the significance level declared for each individual binomial test. One may object to the value of the resultant risk of misclassification, but this does not raise concerns about SCV.
In sum, the use of repeated testing with optional stopping threatens SCV for lack of control of Type-I and Type-II error rates. A simple way around this is to refrain from these practices and adhere to the fixed sampling assumptions of statistical tests; otherwise, use the statistical methods that have been developed for use with repeated testing and optional stopping.
Preliminary Tests of Assumptions
To derive the sampling distribution of test statistics used in parametric NHST, some assumptions must be made about the probability distribution of the observations or about the parameters of these distributions. The assumptions of normality of distributions (in all tests), homogeneity of variances (in Student’s two-sample t test for means or in ANOVAs involving between-subjects factors), sphericity (in repeated-measures ANOVAs), homoscedasticity (in regression analyses), or homogeneity of regression slopes (in ANCOVAs) are well known cases. The data on hand may or may not meet these assumptions and some parametric tests have been devised under alternative assumptions (e.g., Welch’s test for two-sample means, or correction factors for the degrees of freedom of F statistics from ANOVAs). Most introductory statistics textbooks emphasize that the assumptions underlying statistical tests must be formally tested to guide the choice of a suitable test statistic for the null hypothesis of interest. Although this recommendation seems reasonable, serious consequences on SCV arise from following it.
Numerous studies conducted over the past decades have shown that the two-stage approach of testing assumptions first and subsequently testing the null hypothesis of interest has severe effects on Type-I and Type-II error rates. It may seem at first sight that this is simply the result of cascaded binary decisions each of which has its own Type-I and Type-II error probabilities; yet, this is the result of more complex interactions of Type-I and Type-II error rates that do not have fixed (empirical) probabilities across the cases that end up treated one way or the other according to the outcomes of the preliminary test: The resultant Type-I and Type-II error rates of the conditional test cannot be predicted from those of the preliminary and conditioned tests. A thorough analysis of what factors affect the Type-I and Type-II error rates of two-stage approaches is beyond the scope of this paper but readers should be aware that nothing suggests in principle that a two-stage approach might be adequate. The situations that have been more thoroughly studied include preliminary goodness-of-fit tests for normality before conducting a one-sample t test ( Easterling and Anderson, 1978 ; Schucany and Ng, 2006 ; Rochon and Kieser, 2011 ), preliminary tests of equality of variances before conducting a two-sample t test for means ( Gans, 1981 ; Moser and Stevens, 1992 ; Zimmerman, 1996 , 2004 ; Hayes and Cai, 2007 ), preliminary tests of both equality of variances and normality preceding two-sample t tests for means ( Rasch et al., 2011 ), or preliminary tests of homoscedasticity before regression analyses ( Caudill, 1988 ; Ng and Wilcox, 2011 ). These and other studies provide evidence that strongly advises against conducting preliminary tests of assumptions. Almost all of these authors explicitly recommended against these practices and hoped for the misleading and misguided advice given in introductory textbooks to be removed. Wells and Hintze(2007 , p. 501) concluded that “checking the assumptions using the same data that are to be analyzed, although attractive due to its empirical nature, is a fruitless endeavor because of its negative ramifications on the actual test of interest.” The ramifications consist of substantial but unknown alterations of Type-I and Type-II error rates and, hence, a breach of SCV.
Some authors suggest that the problem can be solved by replacing the formal test of assumptions with a decision based on a suitable graphical display of the data that helps researchers judge by eye whether the assumption is tenable. It should be emphasized that the problem still remains, because the decision on how to analyze the data is conditioned on the results of a preliminary analysis. The problem is not brought about by a formal preliminary test, but by the conditional approach to data analysis. The use of a non-formal preliminary test only prevents a precise investigation of the consequences on Type-I and Type-II error rates. But the “out of sight, out of mind” philosophy does not eliminate the problem.
It thus seems that a researcher must make a choice between two evils: either not testing assumptions (and, thus, threatening SCV as a result of the uncontrolled Type-I and Type-II error rates that arise from a potentially undue application of the statistical test) or testing them (and, then, also losing control of Type-I and Type-II error rates owing to the two-stage approach). Both approaches are inadequate, as applying non-robust statistical tests to data that do not satisfy the assumptions has generally as severe implications on SCV as testing preliminary assumptions in a two-stage approach. One of the solutions to the dilemma consists of switching to statistical procedures that have been designed for use under the two-stage approach. For instance, Albers et al. (2000) used second-order asymptotics to derive the size and power of a two-stage test for independent means preceded by a test of equality of variances. Unfortunately, derivations of this type are hard to carry out and, hence, they are not available for most of the cases of interest. A second solution consists of using classical test statistics that have been shown to be robust to violation of their assumptions. Indeed, dependable unconditional tests for means or for regression parameters have been identified (see Sullivan and D’Agostino, 1992 ; Lumley et al., 2002 ; Zimmerman, 2004 , 2011 ; Hayes and Cai, 2007 ; Ng and Wilcox, 2011 ). And a third solution is switching to modern robust methods (see, e.g., Wilcox and Keselman, 2003 ; Keselman et al., 2004 ; Wilcox, 2006 ; Erceg-Hurn and Mirosevich, 2008 ; Fried and Dehling, 2011 ).
Avoidance of the two-stage approach in either of these ways will restore SCV while observing the important requirement that statistical methods should be used whose assumptions are not violated by the characteristics of the data.
Regression as a Means to Investigate Bivariate Relations of all Types
Correlational methods define one of the branches of scientific psychology ( Cronbach, 1957 ) and they are still widely used these days in some areas of psychology. Whether in regression analyses or in latent variable analyses ( Bollen, 2002 ), vast amounts of data are subjected to these methods. Regression analyses rely on an assumption that is often overlooked in psychology, namely, that the predictor variables have fixed values and are measured without error. This assumption, whose validity can obviously be assessed without recourse to any preliminary statistical test, is listed in all statistics textbooks.
In some areas of psychology, predictors actually have this characteristic because they are physical variables defining the magnitude of stimuli, and any error with which these magnitudes are measured (or with which stimuli with the selected magnitudes are created) is negligible in practice. Among others, this is the case in psychophysical studies aimed at estimating psychophysical functions describing the form of the relation between physical magnitude and perceived magnitude (e.g., Green, 1982 ) or psychometric functions describing the form of the relation between physical magnitude and performance in a detection, discrimination, or identification task ( Armstrong and Marks, 1997 ; Saberi and Petrosyan, 2004 ; García-Pérez et al., 2011 ). Regression or analogous methods are typically used to estimate the parameters of these relations, with stimulus magnitude as the independent variable and perceived magnitude (or performance) as the dependent variable. The use of regression in these cases is appropriate because the independent variable has fixed values measured without error (or with a negligible error). Another area in which the use of regression is permissible is in simulation studies on parameter recovery ( García-Pérez et al., 2010 ), where the true parameters generating the data are free of measurement error by definition.
But very few other predictor variables used in psychology meet this requirement, as they are often test scores or performance measures that are typically affected by non-negligible and sometimes large measurement error. This is the case of the proportion of hits and the proportion of false alarms in psychophysical tasks, whose theoretical relation is linear under some signal detection models ( DeCarlo, 1998 ) and, thus, suggests the use of simple linear regression to estimate its parameters. Simple linear regression is also sometimes used as a complement to statistical tests of equality of means in studies in which equivalence or agreement is assessed (e.g., Maylor and Rabbitt, 1993 ; Baddeley and Wilson, 2002 ), and in these cases equivalence implies that the slope should not differ significantly from unity and that the intercept should not differ significantly from zero. The use of simple linear regression is also widespread in priming studies after Greenwald et al. (1995 ; see also Draine and Greenwald, 1998 ), where the intercept (and sometimes the slope) of the linear regression of priming effect on detectability of the prime are routinely subjected to NHST.
In all the cases just discussed and in many others where the X variable in the regression of Y on X is measured with error, a study of the relation between X and Y through regression is inadequate and has serious consequences on SCV. The least of these problems is that there is no basis for assigning the roles of independent and dependent variable in the regression equation (as a non-directional relation exists between the variables, often without even a temporal precedence relation), but regression parameters will differ according to how these roles are assigned. In influential papers of which most researchers in psychology seem to be unaware, Wald (1940) and Mandansky (1959) distinguished regression relations from structural relations, the latter reflecting the case in which both variables are measured with error. Both authors illustrated the consequences of fitting a regression line when a structural relation is involved and derived suitable estimators and significance tests for the slope and intercept parameters of a structural relation. This topic was brought to the attention of psychologists by Isaac (1970) in a criticism of Treisman and Watts’ (1966) use of simple linear regression to assess the equivalence of two alternative estimates of psychophysical sensitivity ( d ′ measures from signal detection theory analyses). The difference between regression and structural relations is briefly mentioned in passing in many elementary books on regression, the issue of fitting structural relations (sometimes referred to as Deming’s regression or the errors-in-variables regression model ) is addressed in detail in most intermediate and advance books on regression (e.g., Fuller, 1987 ; Draper and Smith, 1998 ) and hands-on tutorials have been published (e.g., Cheng and Van Ness, 1994 ; Dunn and Roberts, 1999 ; Dunn, 2007 ). But this type of analysis is not in the toolbox of the average researcher in psychology 1 . In contrast, recourse to this type analysis is quite common in the biomedical sciences.
Use of this commendable method may generalize when researchers realize that estimates of the slope β and the intercept α of a structural relation can be easily computed through
where X ̄ , Ȳ , S x 2 , S y 2 , and S x y are the sample means, variances, and covariance of X and Y , and λ = σ ε y 2 ∕ σ ε x 2 is the ratio of the variances of measurement errors in Y and in X . When X and Y are the same variable measured at different times or under different conditions (as in Maylor and Rabbitt, 1993 ; Baddeley and Wilson, 2002 ), λ = 1 can safely be assumed (for an actual application, see Smith et al., 2004 ). In other cases, a rough estimate can be used, as the estimates of α and β have been shown to be robust except under extreme departures of the guesstimated λ from its true value ( Ketellapper, 1983 ).
For illustration, consider Yeshurun et al. (2008) comparison of signal detection theory estimates of d ′ in each of the intervals of a two alternative forced-choice task, which they pronounced different as revealed by a regression analysis through the origin. Note that this is the context in which Isaac (1970) had illustrated the inappropriateness of regression. The data are shown in Figure 1 , and Yeshurun et al. rejected equality of d 1 ′ and d 2 ′ because the regression slope through the origin (red line, whose slope is 0.908) differed significantly from unity: The 95% confidence interval for the slope ranged between 0.844 and 0.973. Using Eqs 1 and 2, the estimated structural relation is instead given by the blue line in Figure 1 . The difference seems minor by eye, but the slope of the structural relation is 0.963, which is not significantly different from unity ( p = 0.738, two-tailed; see Isaac, 1970 , p. 215). This outcome, which reverses a conclusion raised upon inadequate data analyses, is representative of other cases in which the null hypothesis H 0 : β = 1 was rejected. The reason is dual: (1) the slope of a structural relation is estimated with severe bias through regression ( Riggs et al., 1978 ; Kalantar et al., 1995 ; Hawkins, 2002 ) and (2) regression-based statistical tests of H 0 : β = 1 render empirical Type-I error rates that are much higher than the nominal rate when both variables are measured with error ( García-Pérez and Alcalá-Quintana, 2011 ).

Figure 1. Replot of data from Yeshurun et al. (2008 , their Figure 8) with their fitted regression line through the origin (red line) and a fitted structural relation (blue line) . The identity line is shown with dashed trace for comparison. For additional analyses bearing on the SCV of the original study, see García-Pérez and Alcalá-Quintana ( 2011 ).
In sum, SCV will improve if structural relations instead of regression equations were fitted when both variables are measured with error.
Type-I and Type-II errors are essential components of the statistical decision theory underlying NHST and, therefore, data can never be expected to answer a research question unequivocally. This paper has promoted a view of SCV that de-emphasizes consideration of these unavoidable errors and considers instead two alternative issues: (1) whether statistical tests are used that match the research design, goals of the study, and formal characteristics of the data and (2) whether they are applied in conditions under which the resultant Type-I and Type-II error rates match those that are declared as limiting the validity of the conclusion. Some examples of common threats to SCV in these respects have been discussed and simple and feasible solutions have been proposed. For reasons of space, another threat to SCV has not been covered in this paper, namely, the problems arising from multiple testing (i.e., in concurrent tests of more than one hypothesis). Multiple testing is commonplace in brain mapping studies and some implications on SCV have been discussed, e.g., by Bennett et al. (2009) , Vul et al. (2009a , b ), and Vecchiato et al. (2010) .
All the discussion in this paper has assumed the frequentist approach to data analysis. In closing, and before commenting on how SCV could be improved, a few words are worth about how Bayesian approaches fare on SCV.
The Bayesian Approach
Advocates of Bayesian approaches to data analysis, hypothesis testing, and model selection (e.g., Jennison and Turnbull, 1990 ; Wagenmakers, 2007 ; Matthews, 2011 ) overemphasize the problems of the frequentist approach and praise the solutions offered by the Bayesian approach: Bayes factors (BFs) for hypothesis testing, credible intervals for interval estimation, Bayesian posterior probabilities, Bayesian information criterion (BIC) as a tool for model selection and, above all else, strict reliance on observed data and independence of the sampling plan (i.e., fixed vs. sequential sampling). There is unquestionable merit in these alternatives and a fair comparison with their frequentist counterparts requires a detailed analysis that is beyond the scope of this paper. Yet, I cannot resist the temptation of commenting on the presumed problems of the frequentist approach and also on the standing of the Bayesian approach with respect to SCV.
One of the preferred objections to p values is that they relate to data that were never collected and which, thus, should not affect the decision of what hypothesis the observed data support or fail to support. Intuitively appealing as it may seem, the argument is flawed because the referent for a p value is not other data sets that could have been observed in undone replications of the same experiment. Instead, the referent is the properties of the test statistic itself, which is guaranteed to have the declared sampling distribution when data are collected as assumed in the derivation of such distribution. Statistical tests are calibrated procedures with known properties, and this calibration is what makes their results interpretable. As is the case for any other calibrated procedure or measuring instrument, the validity of the outcome only rests on adherence to the usage specifications. And, of course, the test statistic and the resultant p value on application cannot be blamed for the consequences of a failure to collect data properly or to apply the appropriate statistical test.
Consider a two-sample t test for means. Those who need a referent may want to notice that the p value for the data from a given experiment relates to the uncountable times that such test has been applied to data from any experiment in any discipline. Calibration of the t test ensures that a proper use with a significance level of, say, 5% will reject a true null hypothesis on 5% of the occasions, no matter what the experimental hypothesis is, what the variables are, what the data are, what the experiment is about, who carries it out, or in what research field. What a p value indicates is how tenable it is that the t statistic will attain the observed value if the null were correct, with only a trivial link to the data observed in the experiment of concern. And this only places in a precise quantitative framework the logic that the man on the street uses to judge, for instance, that getting struck by lightning four times over the past 10 years is not something that could identically have happened to anybody else, or that the source of a politician’s huge and untraceable earnings is not the result of allegedly winning top lottery prizes numerous times over the past couple of years. In any case, the advantage of the frequentist approach as regards SCV is that the probability of a Type-I or a Type-II error can be clearly and unequivocally stated, which is not to be mistaken for a statement that a p value is the probability of a Type-I error in the current case, or that it is a measure of the strength of evidence against the null that the current data provide. The most prevalent problems of p values are their potential for misuse and their widespread misinterpretation ( Nickerson, 2000 ). But misuse or misinterpretation do not make NHST and p values uninterpretable or worthless.
Bayesian approaches are claimed to be free of these presumed problems, yielding a conclusion that is exclusively grounded on the data. In a naive account of Bayesian hypothesis testing, Malakoff (1999) attributes to biostatistician Steven Goodman the assertion that the Bayesian approach “says there is an X% probability that your hypothesis is true–not that there is some convoluted chance that if you assume the null hypothesis is true, you will get a similar or more extreme result if you repeated your experiment thousands of times.” Besides being misleading and reflecting a poor understanding of the logic of calibrated NHST methods, what goes unmentioned in this and other accounts is that the Bayesian potential to find out the probability that the hypothesis is true will not materialize without two crucial extra pieces of information. One is the a priori probability of each of the competing hypotheses, which certainly does not come from the data. The other is the probability of the observed data under each of the competing hypothesis, which has the same origin as the frequentist p value and whose computation requires distributional assumptions that must necessarily take the sampling method into consideration.
In practice, Bayesian hypothesis testing generally computes BFs and the result might be stated as “the alternative hypothesis is x times more likely than the null,” although the probability that this type of statement is wrong is essentially unknown. The researcher may be content with a conclusion of this type, but how much of these odds comes from the data and how much comes from the extra assumptions needed to compute a BF is undecipherable. In many cases research aims at gathering and analyzing data to make informed decisions such as whether application of a treatment should be discontinued, whether changes should be introduced in an educational program, whether daytime headlights should be enforced, or whether in-car use of cell phones should be forbidden. Like frequentist analyses, Bayesian approaches do not guarantee that the decisions will be correct. One may argue that stating how much more likely is one hypothesis over another bypasses the decision to reject or not reject any of them and, then, that Bayesian approaches to hypothesis testing are free of Type-I and Type-II errors. Although this is technically correct, the problem remains from the perspective of SCV: Statistics is only a small part of a research process whose ultimate goal is to reach a conclusion and make a decision, and researchers are in a better position to defend their claims if they can supplement them with a statement of the probability with which those claims are wrong.
Interestingly, analyses of decisions based on Bayesian approaches have revealed that they are no better than frequentist decisions as regards Type-I and Type-II errors and that parametric assumptions (i.e., the choice of prior and the assumed distribution of the observations) crucially determine the performance of Bayesian methods. For instance, Bayesian estimation is also subject to potentially large bias and lack of precision ( Alcalá-Quintana and García-Pérez, 2004 ; García-Pérez and Alcalá-Quintana, 2007 ), the coverage probability of Bayesian credible intervals can be worse than that of frequentist confidence intervals ( Agresti and Min, 2005 ; Alcalá-Quintana and García-Pérez, 2005 ), and the Bayesian posterior probability in hypothesis testing can be arbitrarily large or small ( Zaslavsky, 2010 ). On another front, use of BIC for model selection may discard a true model as often as 20% of the times, while a concurrent 0.05-size chi-square test rejects the true model between 3 and 7% of times, closely approximating its stated performance (García-Pérez and Alcalá-Quintana, 2012 ). In any case, the probabilities of Type-I and Type-II errors in practical decisions made from the results of Bayesian analyses will always be unknown and beyond control.
Improving the SCV of Research
Most breaches of SCV arise from a poor understanding of statistical procedures and the resultant inadequate usage. These problems can be easily corrected, as illustrated in this paper, but the problems will not have arisen if researchers had had a better statistical training in the first place. There was a time in which one simply could not run statistical tests without a moderate understanding of NHST. But these days the application of statistical tests is only a mouse-click away and all that students regard as necessary is learning the rule by which p values pouring out of statistical software tell them whether the hypothesis is to be accepted or rejected, as the study of Hoekstra et al. (2012) seems to reveal.
One way to eradicate the problem is by improving statistical education at undergraduate and graduate levels, perhaps not just focusing on giving formal training on a number of methods but by providing students with the necessary foundations that will subsequently allow them to understand and apply methods for which they received no explicit formal training. In their analysis of statistical errors in published papers, Milligan and McFillen(1984 , p. 461) concluded that “in doing projects, it is not unusual for applied researchers or students to use or apply a statistical procedure for which they have received no formal training. This is as inappropriate as a person conducting research in a given content area before reading the existing background literature on the topic. The individual simply is not prepared to conduct quality research. The attitude that statistical technology is secondary or less important to a person’s formal training is shortsighted. Researchers are unlikely to master additional statistical concepts and techniques after leaving school. Thus, the statistical training in many programs must be strengthened. A single course in experimental design and a single course in multivariate analysis is probably insufficient for the typical student to master the course material. Someone who is trained only in theory and content will be ill-prepared to contribute to the advancement of the field or to critically evaluate the research of others.” But statistical education does not seem to have changed much over the subsequent 25 years, as revealed by survey studies conducted by Aiken et al. (1990) , Friedrich et al. (2000) , Aiken et al. (2008) , and Henson et al. (2010) . Certainly some work remains to be done in this arena, and I can only second the proposals made in the papers just cited. But there is also the problem of the unhealthy over-reliance on narrow-breadth, clickable software for data analysis, which practically obliterates any efforts that are made to teach and promote alternatives (see the list of “Pragmatic Factors” discussed by Borsboom, 2006 , pp. 431–434).
The last trench in the battle against breaches of SCV is occupied by journal editors and reviewers. Ideally, they also watch for problems in these respects. There is no known in-depth analysis of the review process in psychology journals (but see Nickerson, 2005 ) and some evidence reveals that the focus of the review process is not always on the quality or validity of the research ( Sternberg, 2002 ; Nickerson, 2005 ). Simmons et al. (2011) and Wicherts et al. (2012) have discussed empirical evidence of inadequate research and review practices (some of which threaten SCV) and they have proposed detailed schemes through which feasible changes in editorial policies may help eradicate not only common threats to SCV but also other threats to research validity in general. I can only second proposals of this type. Reviewers and editors have the responsibility of filtering out (or requesting amendments to) research that does not meet the journal’s standards, including SCV. The analyses of Milligan and McFillen (1984) and Nieuwenhuis et al. (2011) reveal a sizeable number of published papers with statistical errors. This indicates that some remains to be done in this arena too, and some journals have indeed started to take action (see Aickin, 2011 ).
Conflict of Interest Statement
The author declares that the research was conducted in the absence of any commercial or financial relationships that could be construed as a potential conflict of interest.
Acknowledgments
This research was supported by grant PSI2009-08800 (Ministerio de Ciencia e Innovación, Spain).
- ^ SPSS includes a regression procedure called “two-stage least squares” which only implements the method described by Mandansky (1959) as “use of instrumental variables” to estimate the slope of the relation between X and Y . Use of this method requires extra variables with specific characteristics (variables which may simply not be available for the problem at hand) and differs meaningfully from the simpler and more generally applicable method to be discussed next
Agresti, A., and Min, Y. (2005). Frequentist performance of Bayesian confidence intervals for comparing proportions in 2 × 2 contingency tables. Biometrics 61, 515–523.
Pubmed Abstract | Pubmed Full Text | CrossRef Full Text
Ahn, C., Overall, J. E., and Tonidandel, S. (2001). Sample size and power calculations in repeated measurement analysis. Comput. Methods Programs Biomed. 64, 121–124.
Aickin, M. (2011). Test ban: policy of the Journal of Alternative and Complementary Medicine with regard to an increasingly common statistical error. J. Altern. Complement. Med. 17, 1093–1094.
Aiken, L. S., West, S. G., and Millsap, R. E. (2008). Doctoral training in statistics, measurement, and methodology in psychology: replication and extension of Aiken, West, Sechrest, and Reno’s (1990) survey of PhD programs in North America. Am. Psychol. 63, 32–50.
Aiken, L. S., West, S. G., Sechrest, L., and Reno, R. R. (1990). Graduate training in statistics, methodology, and measurement in psychology: a survey of PhD programs in North America. Am. Psychol. 45, 721–734.
CrossRef Full Text
Albers, W., Boon, P. C., and Kallenberg, W. C. M. (2000). The asymptotic behavior of tests for normal means based on a variance pre-test. J. Stat. Plan. Inference 88, 47–57.
Alcalá-Quintana, R., and García-Pérez, M. A. (2004). The role of parametric assumptions in adaptive Bayesian estimation. Psychol. Methods 9, 250–271.
Alcalá-Quintana, R., and García-Pérez, M. A. (2005). Stopping rules in Bayesian adaptive threshold estimation. Spat. Vis. 18, 347–374.
Anscombe, F. J. (1953). Sequential estimation. J. R. Stat. Soc. Series B 15, 1–29.
Anscombe, F. J. (1954). Fixed-sample-size analysis of sequential observations. Biometrics 10, 89–100.
Armitage, P., McPherson, C. K., and Rowe, B. C. (1969). Repeated significance tests on accumulating data. J. R. Stat. Soc. Ser. A 132, 235–244.
Armstrong, L., and Marks, L. E. (1997). Differential effect of stimulus context on perceived length: implications for the horizontal–vertical illusion. Percept. Psychophys. 59, 1200–1213.
Austin, J. T., Boyle, K. A., and Lualhati, J. C. (1998). Statistical conclusion validity for organizational science researchers: a review. Organ. Res. Methods 1, 164–208.
Baddeley, A., and Wilson, B. A. (2002). Prose recall and amnesia: implications for the structure of working memory. Neuropsychologia 40, 1737–1743.
Bakker, M., and Wicherts, J. M. (2011). The (mis) reporting of statistical results in psychology journals. Behav. Res. Methods 43, 666–678.
Bauer, P., and Köhne, K. (1994). Evaluation of experiments with adaptive interim analyses. Biometrics 50, 1029–1041.
Beins, B. C. (2009). Research Methods. A Tool for Life , 2nd Edn. Boston, MA: Pearson Education.
Bennett, C. M., Wolford, G. L., and Miller, M. B. (2009). The principled control of false positives in neuroimaging. Soc. Cogn. Affect. Neurosci. 4, 417–422.
Bland, J. M., and Altman, D. G. (2011). Comparisons against baseline within randomised groups are often used and can be highly misleading. Trials 12, 264.
Bollen, K. A. (2002). Latent variables in psychology and the social sciences. Annu. Rev. Psychol. 53, 605–634.
Boos, D. D., and Hughes-Oliver, J. M. (2000). How large does n have to be for Z and t intervals? Am. Stat. 54, 121–128.
Borsboom, D. (2006). The attack of the psychometricians. Psychometrika 71, 425–440.
Botella, J., Ximenez, C., Revuelta, J., and Suero, M. (2006). Optimization of sample size in controlled experiments: the CLAST rule. Behav. Res. Methods Instrum. Comput. 38, 65–76.
Campbell, D. T., and Stanley, J. C. (1966). Experimental and Quasi-Experimental Designs for Research . Chicago, IL: Rand McNally.
Caudill, S. B. (1988). Type I errors after preliminary tests for heteroscedasticity. Statistician 37, 65–68.
Chen, Y. H. J., DeMets, D. L., and Lang, K. K. G. (2004). Increasing sample size when the unblinded interim result is promising. Stat. Med. 23, 1023–1038.
Cheng, C. L., and Van Ness, J. W. (1994). On estimating linear relationships when both variables are subject to errors. J. R. Stat. Soc. Series B 56, 167–183.
Cook, T. D., and Campbell, D. T. (1979). Quasi-Experimentation: Design and Analysis Issues for Field Settings . Boston, MA: Houghton Mifflin.
Crawford, E. D., Blumenstein, B., and Thompson, I. (1998). Type III statistical error. Urology 51, 675.
Cronbach, L. J. (1957). The two disciplines of scientific psychology. Am. Psychol. 12, 671–684.
DeCarlo, L. T. (1998). Signal detection theory and generalized linear models. Psychol. Methods 3, 186–205.
Dell, R. B., Holleran, S., and Ramakrishnan, R. (2002). Sample size determination. ILAR J. 43, 207–213.
Pubmed Abstract | Pubmed Full Text
Draine, S. C., and Greenwald, A. G. (1998). Replicable unconscious semantic priming. J. Exp. Psychol. Gen. 127, 286–303.
Draper, N. R., and Smith, H. (1998). Applied Regression Analysis , 3rd Edn. New York: Wiley.
Dunn, G. (2007). Regression models for method comparison data. J. Biopharm. Stat. 17, 739–756.
Dunn, G., and Roberts, C. (1999). Modelling method comparison data. Stat. Methods Med. Res. 8, 161–179.
Easterling, R. G., and Anderson, H. E. (1978). The effect of preliminary normality goodness of fit tests on subsequent inference. J. Stat. Comput. Simul. 8, 1–11.
Elvik, R. (1998). Evaluating the statistical conclusion validity of weighted mean results in meta-analysis by analysing funnel graph diagrams. Accid. Anal. Prev. 30, 255–266.
Erceg-Hurn, C. M., and Mirosevich, V. M. (2008). Modern robust statistical methods: an easy way to maximize the accuracy and power of your research. Am. Psychol. 63, 591–601.
Faul, F., Erdfelder, E., Lang, A.-G., and Buchner, A. (2007). G*Power 3: a flexible statistical power analysis program for the social, behavioral, and biomedical sciences. Behav. Res. Methods 39, 175–191.
Fitts, D. A. (2010a). Improved stopping rules for the design of efficient small-sample experiments in biomedical and biobehavioral research. Behav. Res. Methods 42, 3–22.
Fitts, D. A. (2010b). The variable-criteria sequential stopping rule: generality to unequal sample sizes, unequal variances, or to large ANOVAs. Behav. Res. Methods 42, 918–929.
Fitts, D. A. (2011a). Ethics and animal numbers: Informal analyses, uncertain sample sizes, inefficient replications, and Type I errors. J. Am. Assoc. Lab. Anim. Sci. 50, 445–453.
Fitts, D. A. (2011b). Minimizing animal numbers: the variable-criteria sequential stopping rule. Comp. Med. 61, 206–218.
Frick, R. W. (1998). A better stopping rule for conventional statistical tests. Behav. Res. Methods Instrum. Comput. 30, 690–697.
Fried, R., and Dehling, H. (2011). Robust nonparametric tests for the two-sample location problem. Stat. Methods Appl. 20, 409–422.
Friedrich, J., Buday, E., and Kerr, D. (2000). Statistical training in psychology: a national survey and commentary on undergraduate programs. Teach. Psychol. 27, 248–257.
Fuller, W. A. (1987). Measurement Error Models . New York: Wiley.
Gans, D. J. (1981). Use of a preliminary test in comparing two sample means. Commun. Stat. Simul. Comput. 10, 163–174.
García-Pérez, M. A. (2005). On the confidence interval for the binomial parameter. Qual. Quant. 39, 467–481.
García-Pérez, M. A., and Alcalá-Quintana, R. (2007). Bayesian adaptive estimation of arbitrary points on a psychometric function. Br. J. Math. Stat. Psychol. 60, 147–174.
García-Pérez, M. A., and Alcalá-Quintana, R. (2011). Testing equivalence with repeated measures: tests of the difference model of two-alternative forced-choice performance. Span. J. Psychol. 14, 1023–1049.
García-Pérez, M. A., and Alcalá-Quintana, R. (2012). On the discrepant results in synchrony judgment and temporal-order judgment tasks: a quantitative model. Psychon. Bull. Rev. (in press). doi:10.3758/s13423-012-0278-y
García-Pérez, M. A., Alcalá-Quintana, R., and García-Cueto, M. A. (2010). A comparison of anchor-item designs for the concurrent calibration of large banks of Likert-type items. Appl. Psychol. Meas. 34, 580–599.
García-Pérez, M. A., Alcalá-Quintana, R., Woods, R. L., and Peli, E. (2011). Psychometric functions for detection and discrimination with and without flankers. Atten. Percept. Psychophys. 73, 829–853.
García-Pérez, M. A., and Núñez-Antón, V. (2009). Statistical inference involving binomial and negative binomial parameters. Span. J. Psychol. 12, 288–307.
Girden, E. R., and Kabacoff, R. I. (2011). Evaluating Research Articles. From Start to Finish , 3rd Edn. Thousand Oaks, CA: Sage.
Goodwin, C. J. (2010). Research in Psychology. Methods and Design , 6th Edn. Hoboken, NJ: Wiley.
Graybill, F. A. (1958). Determining sample size for a specified width confidence interval. Ann. Math. Stat. 29, 282–287.
Green, B. G. (1982). The perception of distance and location for dual tactile figures. Percept. Psychophys. 31, 315–323.
Greenwald, A. G., Klinger, M. R., and Schuh, E. S. (1995). Activation by marginally perceptible (“subliminal”) stimuli: dissociation of unconscious from conscious cognition. J. Exp. Psychol. Gen. 124, 22–42.
Hawkins, D. M. (2002). Diagnostics for conformity of paired quantitative measurements. Stat. Med. 21, 1913–1935.
Hayes, A. F., and Cai, L. (2007). Further evaluating the conditional decision rule for comparing two independent means. Br. J. Math. Stat. Psychol. 60, 217–244.
Henson, R. K., Hull, D. M., and Williams, C. S. (2010). Methodology in our education research culture: toward a stronger collective quantitative proficiency. Educ. Res. 39, 229–240.
Hoekstra, R., Kiers, H., and Johnson, A. (2012). Are assumptions of well-known statistical techniques checked, and why (not)? Front. Psychol. 3:137. doi:10.3389/fpsyg.2012.00137
Howard, G. S., Obledo, F. H., Cole, D. A., and Maxwell, S. E. (1983). Linked raters’ judgments: combating problems of statistical conclusion validity. Appl. Psychol. Meas. 7, 57–62.
Isaac, P. D. (1970). Linear regression, structural relations, and measurement error. Psychol. Bull. 74, 213–218.
Jan, S.-L., and Shieh, G. (2011). Optimal sample sizes for Welch’s test under various allocation and cost considerations. Behav. Res. Methods 43, 1014–1022.
Jennison, C., and Turnbull, B. W. (1990). Statistical approaches to interim monitoring of clinical trials: a review and commentary. Stat. Sci. 5, 299–317.
John, L. K., Loewenstein, G., and Prelec, D. (2012). Measuring the prevalence of questionable research practices with incentives for truth telling. Psychol. Sci. 23, 524–532.
Kalantar, A. H., Gelb, R. I., and Alper, J. S. (1995). Biases in summary statistics of slopes and intercepts in linear regression with errors in both variables. Talanta 42, 597–603.
Keselman, H. J., Othman, A. R., Wilcox, R. R., and Fradette, K. (2004). The new and improved two-sample t test. Psychol. Sci. 15, 47–51.
Ketellapper, R. H. (1983). On estimating parameters in a simple linear errors-in-variables model. Technometrics 25, 43–47.
Lee, B. (1985). Statistical conclusion validity in ex post facto designs: practicality in evaluation. Educ. Eval. Policy Anal. 7, 35–45.
Lippa, R. A. (2007). The relation between sex drive and sexual attraction to men and women: a cross-national study of heterosexual, bisexual, and homosexual men and women. Arch. Sex. Behav. 36, 209–222.
Lumley, T., Diehr, P., Emerson, S., and Chen, L. (2002). The importance of the normality assumption in large public health data sets. Annu. Rev. Public Health 23, 151–169.
Malakoff, D. (1999). Bayes offers a “new” way to make sense of numbers. Science 286, 1460–1464.
Mandansky, A. (1959). The fitting of straight lines when both variables are subject to error. J. Am. Stat. Assoc. 54, 173–205.
Matthews, W. J. (2011). What might judgment and decision making research be like if we took a Bayesian approach to hypothesis testing? Judgm. Decis. Mak. 6, 843–856.
Maxwell, S. E., Kelley, K., and Rausch, J. R. (2008). Sample size planning for statistical power and accuracy in parameter estimation. Annu. Rev. Psychol. 59, 537–563.
Maylor, E. A., and Rabbitt, P. M. A. (1993). Alcohol, reaction time and memory: a meta-analysis. Br. J. Psychol. 84, 301–317.
McCarroll, D., Crays, N., and Dunlap, W. P. (1992). Sequential ANOVAs and type I error rates. Educ. Psychol. Meas. 52, 387–393.
Mehta, C. R., and Pocock, S. J. (2011). Adaptive increase in sample size when interim results are promising: a practical guide with examples. Stat. Med. 30, 3267–3284.
Milligan, G. W., and McFillen, J. M. (1984). Statistical conclusion validity in experimental designs used in business research. J. Bus. Res. 12, 437–462.
Morse, D. T. (1998). MINSIZE: a computer program for obtaining minimum sample size as an indicator of effect size. Educ. Psychol. Meas. 58, 142–153.
Morse, D. T. (1999). MINSIZE2: a computer program for determining effect size and minimum sample size for statistical significance for univariate, multivariate, and nonparametric tests. Educ. Psychol. Meas. 59, 518–531.
Moser, B. K., and Stevens, G. R. (1992). Homogeneity of variance in the two-sample means test. Am. Stat. 46, 19–21.
Ng, M., and Wilcox, R. R. (2011). A comparison of two-stage procedures for testing least-squares coefficients under heteroscedasticity. Br. J. Math. Stat. Psychol. 64, 244–258.
Nickerson, R. S. (2000). Null hypothesis significance testing: a review of an old and continuing controversy. Psychol. Methods 5, 241–301.
Nickerson, R. S. (2005). What authors want from journal reviewers and editors. Am. Psychol. 60, 661–662.
Nieuwenhuis, S., Forstmann, B. U., and Wagenmakers, E.-J. (2011). Erroneous analyses of interactions in neuroscience: a problem of significance. Nat. Neurosci. 14, 1105–1107.
Nisen, J. A., and Schwertman, N. C. (2008). A simple method of computing the sample size for chi-square test for the equality of multinomial distributions. Comput. Stat. Data Anal. 52, 4903–4908.
Orme, J. G. (1991). Statistical conclusion validity for single-system designs. Soc. Serv. Rev. 65, 468–491.
Ottenbacher, K. J. (1989). Statistical conclusion validity of early intervention research with handicapped children. Except. Child. 55, 534–540.
Ottenbacher, K. J., and Maas, F. (1999). How to detect effects: statistical power and evidence-based practice in occupational therapy research. Am. J. Occup. Ther. 53, 181–188.
Rankupalli, B., and Tandon, R. (2010). Practicing evidence-based psychiatry: 1. Applying a study’s findings: the threats to validity approach. Asian J. Psychiatr. 3, 35–40.
Rasch, D., Kubinger, K. D., and Moder, K. (2011). The two-sample t test: pre-testing its assumptions does not pay off. Stat. Pap. 52, 219–231.
Riggs, D. S., Guarnieri, J. A., and Addelman, S. (1978). Fitting straight lines when both variables are subject to error. Life Sci. 22, 1305–1360.
Rochon, J., and Kieser, M. (2011). A closer look at the effect of preliminary goodness-of-fit testing for normality for the one-sample t-test. Br. J. Math. Stat. Psychol. 64, 410–426.
Saberi, K., and Petrosyan, A. (2004). A detection-theoretic model of echo inhibition. Psychol. Rev. 111, 52–66.
Schucany, W. R., and Ng, H. K. T. (2006). Preliminary goodness-of-fit tests for normality do not validate the one-sample Student t. Commun. Stat. Theory Methods 35, 2275–2286.
Shadish, W. R., Cook, T. D., and Campbell, D. T. (2002). Experimental and Quasi-Experimental Designs for Generalized Causal Inference . Boston, MA: Houghton Mifflin.
Shieh, G., and Jan, S.-L. (2012). Optimal sample sizes for precise interval estimation of Welch’s procedure under various allocation and cost considerations. Behav. Res. Methods 44, 202–212.
Shun, Z. M., Yuan, W., Brady, W. E., and Hsu, H. (2001). Type I error in sample size re-estimations based on observed treatment difference. Stat. Med. 20, 497–513.
Simmons, J. P., Nelson, L. D., and Simoshohn, U. (2011). False-positive psychology: undisclosed flexibility in data collection and analysis allows presenting anything as significant. Psychol. Sci. 22, 1359–1366.
Smith, P. L., Wolfgang, B. F., and Sinclair, A. J. (2004). Mask-dependent attentional cuing effects in visual signal detection: the psychometric function for contrast. Percept. Psychophys. 66, 1056–1075.
Sternberg, R. J. (2002). On civility in reviewing. APS Obs. 15, 34.
Stevens, W. L. (1950). Fiducial limits of the parameter of a discontinuous distribution. Biometrika 37, 117–129.
Strube, M. J. (2006). SNOOP: a program for demonstrating the consequences of premature and repeated null hypothesis testing. Behav. Res. Methods 38, 24–27.
Sullivan, L. M., and D’Agostino, R. B. (1992). Robustness of the t test applied to data distorted from normality by floor effects. J. Dent. Res. 71, 1938–1943.
Treisman, M., and Watts, T. R. (1966). Relation between signal detectability theory and the traditional procedures for measuring sensory thresholds: estimating d’ from results given by the method of constant stimuli. Psychol. Bull. 66, 438–454.
Vecchiato, G., Fallani, F. V., Astolfi, L., Toppi, J., Cincotti, F., Mattia, D., Salinari, S., and Babiloni, F. (2010). The issue of multiple univariate comparisons in the context of neuroelectric brain mapping: an application in a neuromarketing experiment. J. Neurosci. Methods 191, 283–289.
Vul, E., Harris, C., Winkielman, P., and Pashler, H. (2009a). Puzzlingly high correlations in fMRI studies of emotion, personality, and social cognition. Perspect. Psychol. Sci. 4, 274–290.
Vul, E., Harris, C., Winkielman, P., and Pashler, H. (2009b). Reply to comments on “Puzzlingly high correlations in fMRI studies of emotion, personality, and social cognition.” Perspect. Psychol. Sci. 4, 319–324.
Wagenmakers, E.-J. (2007). A practical solution to the pervasive problems of p values. Psychon. Bull. Rev. 14, 779–804.
Wald, A. (1940). The fitting of straight lines if both variables are subject to error. Ann. Math. Stat. 11, 284–300.
Wald, A. (1947). Sequential Analysis . New York: Wiley.
Wells, C. S., and Hintze, J. M. (2007). Dealing with assumptions underlying statistical tests. Psychol. Sch. 44, 495–502.
Wetherill, G. B. (1966). Sequential Methods in Statistics . London: Chapman and Hall.
Wicherts, J. M., Kievit, R. A., Bakker, M., and Borsboom, D. (2012). Letting the daylight in: reviewing the reviewers and other ways to maximize transparency in science. Front. Comput. Psychol. 6:20. doi:10.3389/fncom.2012.00020
Wilcox, R. R. (2006). New methods for comparing groups: strategies for increasing the probability of detecting true differences. Curr. Dir. Psychol. Sci. 14, 272–275.
Wilcox, R. R., and Keselman, H. J. (2003). Modern robust data analysis methods: measures of central tendency. Psychol. Methods 8, 254–274.
Wilkinson, L.The Task Force on Statistical Inference. (1999). Statistical methods in psychology journals: guidelines and explanations. Am. Psychol. 54, 594–604.
Ximenez, C., and Revuelta, J. (2007). Extending the CLAST sequential rule to one-way ANOVA under group sampling. Behav. Res. Methods Instrum. Comput. 39, 86–100.
Xu, E. R., Knight, E. J., and Kralik, J. D. (2011). Rhesus monkeys lack a consistent peak-end effect. Q. J. Exp. Psychol. 64, 2301–2315.
Yeshurun, Y., Carrasco, M., and Maloney, L. T. (2008). Bias and sensitivity in two-interval forced choice procedures: tests of the difference model. Vision Res. 48, 1837–1851.
Zaslavsky, B. G. (2010). Bayesian versus frequentist hypotheses testing in clinical trials with dichotomous and countable outcomes. J. Biopharm. Stat. 20, 985–997.
Zimmerman, D. W. (1996). Some properties of preliminary tests of equality of variances in the two-sample location problem. J. Gen. Psychol. 123, 217–231.
Zimmerman, D. W. (2004). A note on preliminary tests of equality of variances. Br. J. Math. Stat. Psychol. 57, 173–181.
Zimmerman, D. W. (2011). A simple and effective decision rule for choosing a significance test to protect against non-normality. Br. J. Math. Stat. Psychol. 64, 388–409.
Keywords: data analysis, validity of research, regression, stopping rules, preliminary tests
Citation: García-Pérez MA (2012) Statistical conclusion validity: some common threats and simple remedies. Front. Psychology 3 :325. doi: 10.3389/fpsyg.2012.00325
Received: 10 May 2012; Paper pending published: 29 May 2012; Accepted: 14 August 2012; Published online: 29 August 2012.
Reviewed by:
Copyright: © 2012 García-Pérez. This is an open-access article distributed under the terms of the Creative Commons Attribution License , which permits use, distribution and reproduction in other forums, provided the original authors and source are credited and subject to any copyright notices concerning any third-party graphics etc.
*Correspondence: Miguel A. García-Pérez, Facultad de Psicología, Departamento de Metodología, Campus de Somosaguas, Universidad Complutense, 28223 Madrid, Spain. e-mail: miguel@psi.ucm.es
Disclaimer: All claims expressed in this article are solely those of the authors and do not necessarily represent those of their affiliated organizations, or those of the publisher, the editors and the reviewers. Any product that may be evaluated in this article or claim that may be made by its manufacturer is not guaranteed or endorsed by the publisher.
What is statistical conclusion validity in research?
A brief introduction to statistical conclusion validity, definition of statistical conclusion validity..
- Internal validity
- External validity
- Construct validity
- Reliability
- Objectivity
Threats to statistical conclusion validity
Strategies to improve statistical conclusion validity..
- Appropriate Sample Size: Ensure that the sample size is large enough to detect meaningful effects. Power analysis can help determine the required sample size for a given effect size and significance level.
- Random Sampling: Use random sampling techniques to create a representative sample that accurately reflects the characteristics of the population.
- Reliable Measurements: Employ reliable and valid measurement instruments to minimize measurement errors. Pilot testing can help identify and rectify measurement issues. This also helps your reliability
- Assumption Checking: Verify the assumptions of chosen statistical tests. If assumptions are violated, consider using alternative methods or transformation techniques.
- Transparent Reporting: Clearly document the methods and procedures used in the study, allowing others to replicate and verify your findings.
Conclusion on statistical conclusion validity.

An official website of the United States government
The .gov means it’s official. Federal government websites often end in .gov or .mil. Before sharing sensitive information, make sure you’re on a federal government site.
The site is secure. The https:// ensures that you are connecting to the official website and that any information you provide is encrypted and transmitted securely.
- Publications
- Account settings
Preview improvements coming to the PMC website in October 2024. Learn More or Try it out now .
- Advanced Search
- Journal List
- Lippincott Open Access
A Graphical Catalog of Threats to Validity
Ellicott c. matthay.
From the Center for Health and Community, University of California, San Francisco, CA.
M. Maria Glymour
Associated data.
Supplemental Digital Content is available in the text.
Directed acyclic graphs (DAGs), a prominent tool for expressing assumptions in epidemiologic research, are most useful when the hypothetical data generating structure is correctly encoded. Understanding a study’s data generating structure and translating that data structure into a DAG can be challenging, but these skills are often glossed over in training. Campbell and Stanley’s framework for causal inference has been extraordinarily influential in social science training programs but has received less attention in epidemiology. Their work, along with subsequent revisions and enhancements based on practical experience conducting empirical studies, presents a catalog of 37 threats to validity describing reasons empirical studies may fail to deliver causal effects. We interpret most of these threats to study validity as suggestions for common causal structures. Threats are organized into issues of statistical conclusion validity, internal validity, construct validity, or external validity. To assist epidemiologists in drawing the correct DAG for their application, we map the correspondence between threats to validity and epidemiologic concepts that can be represented with DAGs. Representing these threats as DAGs makes them amenable to formal analysis with d-separation rules and breaks down cross-disciplinary language barriers in communicating methodologic issues.
Directed acyclic graphs (DAGs) have rapidly gained popularity among epidemiologists. DAGs are a particularly useful tool for causal inference because, when one has correctly specified the hypothetical DAG to encode prior knowledge of the data generating structure, a set of mathematics-based rules can be applied to determine whether and how the causal effect of interest can be identified—for example, which confounders need to be controlled. However, the DAG framework is entirely silent on what the causal model should look like, and epidemiologists often struggle to tie their methodologic training in DAGs to specific, real-world settings.
Nearly 50 years ago, Campbell and Stanley 1 presented a catalog of threats to validity, describing reasons empirical studies may fail to deliver causal effects. Their work, along with subsequent revisions 2 , 3 (hereafter, “the Campbell tradition”), has been extraordinarily influential in social science training programs, 4 , 5 but has received less attention in epidemiology. The framework delineates four types of validity—internal, statistical conclusion, construct, and external (Box 1). The Campbell tradition guides researchers to assess alternative explanations for an association besides the causal relation of interest (“threats to validity”) when evaluating evidence from a specific study design and analysis, and to incorporate design or analysis features—for example, randomization or masking—to diminish the influence of such threats. The Campbell tradition’s most recent set of 37 threats to validity are based on decades of empirical research experience. They are verbal descriptions of biases that can arise in epidemiologic research. Most can be considered possible causal structures and represented in a DAG. Epidemiologic research and, in particular, the challenging task of correctly drawing one’s DAG, could be enhanced by considering these threats. However, to our knowledge, no comprehensive crosswalk between the Campbell tradition’s named biases and DAGs has been published. The DAG for threats deemed plausible in the given study context can be incorporated into the investigator’s DAG to provide insight into the problem and to determine effective analytic solutions.
SHADISH, COOK, AND CAMPBELL’S VALIDITY TYPOLOGY
- Statistical conclusion validity: appropriate use of statistical methods to assess the relationships among study variables;
- Internal validity: the extent to which the estimated association in the study sample corresponds to a causal effect from exposure to outcome;
- Construct validity: the extent to which measured variables capture the concepts the investigator intends to assess with those measures; and
- External validity: the extent to which study results can be generalized to other units, treatments, observations made on units, and settings of study conduct.
We define the Campbell tradition’s named threats to validity. For each threat, we provide the epidemiologic analog, a corresponding DAG, and one or more examples, to illustrate how they might inform the epidemiologist’s DAGs. We aim to enhance epidemiologic research by facilitating the use of cross-disciplinary concepts to inform DAG specification and to facilitate cross-disciplinary communication by using DAGs as common language to understand biases in causal research.
REPRESENTING THREATS TO VALIDITY AS DIRECTED ACYCLIC GRAPHS
DAGs are causal models that visually represent background knowledge and assumptions about the relationships between variables. 6 They encode the hypothesized data generating mechanisms and can include features of the study design such as instruments and study implementation such as measurement. DAGs are interpreted with mathematics-based rules that provide a flexible but rigorous method for determining sets of variables that, when measured and adjusted appropriately, are sufficient to control confounding and identify causal effects. Box 2 presents an introduction to key concepts of DAGs and notation used in this article. For a more detailed introduction, we refer the reader to Glymour and Greenland. 7
INTRODUCTION TO KEY CONCEPTS OF DIRECTED ACYCLIC GRAPHS
DAGs are comprised of variables (“nodes”) and directed arrows (“edges”) that indicate potential direct causal effects of one node on another. A “path” is a sequence of nodes following edges, not necessarily in the indicated direction, from one node in the graph to another. DAGs are “acyclic,” meaning no directed path leads back to the same node. Direct and indirect effects of a node are referred to as its “descendants.” A “backdoor path” is a path connecting the outcome and exposure but with an arrow pointing into the exposure. “Colliders” on a path are nodes with at least two directed arrows pointing into them from other nodes on the path. Paths are “blocked” by conditioning on a proposed covariate set if either (1) one or more nodes on the path are in the covariate set or (2) the path contains at least one collider and neither the collider nor any of its descendants are in the covariate set. The “backdoor criterion” can be used to identify the necessary set of variables that must be appropriately measured and controlled for unbiased estimation of the causal effect of interest. It states that a set of variables is sufficient to control confounding if (1) no variables in the set are a consequence of the treatment and (2) conditioning on the set of variables blocks all backdoor paths from the outcome to the treatment.
Example Directed Acyclic Graph:
Notation: DAGs include the following variables: E, the exposure or treatment received; D, the outcome; U, unmeasured confounders, variation, or error, with subscripts referring to the variables they affect; T, treatment assignment (i.e., in the context of randomization, where assigned treatment may not equal actual exposure); S, selection into treatment or into the study; and M, a mediator. Numerical subscripts indicate time of measurement or multiple components of the corresponding variable. The subscript “m” indicates a (possibly incorrect) measurement of the corresponding variable (e.g., we distinguish between depression as a latent construct and depression as measured, perhaps using a scale of depressive symptoms).
For each threat below, the DAG provided is either the archetypal causal structure, or one or more examples of possible causal structures. For threats that may arise with or without a direct causal effect from exposure to outcome (e.g., under the null), we generally exclude the directed edge from exposure to outcome. A directed edge from the exposure to the outcome is included when the threat is only applicable when there is a direct causal effect of the exposure on the outcome. Threats that are redundant, arise less frequently in epidemiology, or are less amenable to DAG representation are presented in the eAppendix; http://links.lww.com/EDE/B634 . No human subjects were involved in this research.
THREATS TO INTERNAL VALIDITY
Threats to internal validity are the central concern of most causal analyses, with violations generally corresponding to confounding or failure to meet the backdoor criterion. 7 Confounding (often referred to as “selection into treatment” or merely “selection” among social scientists) constitutes a core threat, but eight others are also delineated and their definitions are presented in Table Table1. 1 . Several of these threats are only relevant, or most commonly relevant, in extremely weak study designs lacking a contemporaneous control group. In these cases, the Campbell tradition’s accounting of reasons these designs are rarely valid helps provide more critical insight into stronger designs. Specifically, history, maturation, regression, testing, and instrumentation are particularly relevant to certain pre–post designs with no comparison. In the DAGs below, this is reflected by backdoor paths involving a time node. The exposure is determined by time (pre vs. post), and time also affects other factors. The result is bias that could be controlled by including a comparable, contemporaneous unexposed group.
Threats to Internal Validity

Ambiguous temporal precedence corresponds to reverse causality in epidemiology (Figure (Figure1 1 A). 8 Ambiguous temporal precedence might arise, for example, when studying the impact of exposure to violence on mental health, because mental disorders may increase an individual’s exposure to violence and exposure to violence can cause mental disorders. 9

Threats to internal validity represented as directed acyclic graphs.
Selection is traditional confounding. 10 In its simplest form, this threat can be represented with the DAG in Figure Figure1B. 1 B. Selection might occur, for example, when studying the impact of multivitamin consumption on breast cancer, where an association might be explained by predisposition to other healthy behaviors.
Threats 3–4
History can be conceptualized as confounding by concurrent events that are associated with the exposure through their alignment in time (Figure (Figure1C). 1 C). For example, history may arise when studying the impact of the introduction of a law requiring seatbelt use on subsequent motor vehicle crash injuries, where an association might be explained by a concurrent change in the safety-related design of new motor vehicles (U). Maturation is conceptually and structurally similar: it is confounding by the natural temporal course of the outcome, where the time scale of interest (and confounding pathway) is often age (Figure (Figure1 1 D). 11 For example, maturation might be problematic when studying the impact of an elderly fall prevention program, because an association might be biased by the fact that risk of falls increases with age, irrespective of the program.
Regression to the mean 12 occurs when participants are selected into treatment based on an extreme measurement of a random variable; less extreme values of the same variable are more likely to be observed in subsequent assessments. This threat is common in situations where participants are treated for their extreme baseline values of the outcome condition. For example, participants might be selected into a study and subsequently treated based on their high baseline blood pressure levels, which would likely decrease with time irrespective of intervention.

Testing can threaten validity when the act of measuring the outcome occurs simultaneous with treatment and affects the measured outcome, such as when weighing a person motivates them to lose weight, irrespective of any weight loss intervention being delivered (Figure (Figure1 1 F).
Instrumentation can be considered a form of confounding by changes in what an instrument is measuring over time. 13 This might occur, for example, in a study of an education policy’s impact on Alzheimer disease, where the diagnostic criteria for Alzheimer disease have changed over time, such that a measured change in risk might be incorrectly attributed to the policy change (Figure (Figure1 1 G).
Attrition is a form of loss to follow-up and can lead to bias in two ways. The first is through collider stratification bias—that is, a statistical association induced by conditioning on a collider. Previous work has enumerated a range of DAGs involving collider stratification bias. 14 , 15 As a simple example, this threat might arise in a study of poverty’s impact on mortality, because poverty influences participants’ ability to stay in the study, although other unmeasured factors also affecting participation (e.g., underlying health status) also influence mortality (Figure (Figure1H). 1 H). Restricting to those not lost to follow-up then involves conditioning on collider S, inducing a spurious association between poverty and mortality.
Attrition can also lead to bias when retention in the study is affected by a factor that modifies the exposure-outcome association (Figure (Figure1I). 1 I). In this scenario, restricting to participants who remain in the study does not bias estimates for the subpopulation who remain in the study, but may provide a biased effect estimate for the baseline population. 15 This issue might arise if poverty causes mortality and another factor (e.g., number of children in the household) impacts both participants’ retention in the study and the effect of poverty on mortality. This scenario also arises in situations of selection of susceptibles, in which those most responsive to treatment drop out first. Losses are informative and conditioning on S by restricting to subjects who remain in the study may bias the measured effect for participants overall. 15 , 16
When evaluating the bias introduced by attrition, it is essential to be specific about the target population of interest. In the second scenario (Figure (Figure1I), 1 I), loss to follow-up may result in biased effect estimates for the baseline study population, but produce valid estimates for the population remaining in the study. The scenario in Figure Figure1I 1 I does not cause bias under the sharp null that E does not affect D for anyone. In the case of collider stratification bias (Figure (Figure1H), 1 H), effect estimates will generally be biased for both the baseline population and the subsample who remain in the study and biased even under the sharp null. Considerations of external validity and specifically the task of identifying the population(s) to whom the results apply helps clarify this issue.
Additive and interactive effects of threats to internal validity refer to multiple biases that may sum together, offset one another, or interact in a single study. For example, in Figure Figure1J, 1 J, a cohort study might be biased by both attrition (if the study conditions on S) and confounding (by U E ). These biases may interact because the degree of attrition S depends on the strength of the upstream relationship of U E to E, and the U E –E relationship also affects the degree of confounding by U E . This situation is distinct from additive or interactive effect measure modification.
THREATS TO STATISTICAL CONCLUSION VALIDITY
Threats to statistical conclusion validity (Table (Table2) 2 ) generally correspond to failures to conduct appropriate statistical inference in epidemiology. This includes ruling out random error, meeting necessary assumptions of the statistical model (e.g., independent and identically distributed observations on units, no interference or spillover), and correctly specifying the statistical model (e.g., the association between age and the outcome is linear). Most discussions of DAGs assume an infinite sample size and therefore disregard the possibility of chance findings or insufficient power. Additionally, because DAGs are nonparametric, many violated assumptions of statistical tests are not represented as DAGs. Thus, most threats to statistical conclusion validity are not represented as DAGs (threats 10–15). However, some threats to statistical conclusion validity are situations of measurement error or modifications to measured variables that reduce statistical power, and several of these can be informatively represented as DAGs (threats 16–18). Several threats (low statistical power; violated assumptions of statistical tests; fishing and the error rate problem) refer to null hypothesis significance testing, which is increasingly recognized as problematic practice. 17 , 18 However, these threats are also relevant to estimation, because they imply that estimates may be imprecise, potentially uninformative, or likely to deviate from the population estimate by chance. We present threats to statistical conclusion validity and corresponding epidemiologic concepts represented as DAGs when relevant in the eAppendix; http://links.lww.com/EDE/B634 .
Threats to Statistical Conclusion Validity

THREATS TO CONSTRUCT VALIDITY
A “construct” is the idea, concept, or theory a researcher intends to capture or measure in a scientific study. Construct validity concerns (Table (Table3) 3 ) relate fundamentally to whether study measurements capture the constructs they are intended to capture. This in turn affects the interpretation of results, the attribution of observed effects, and the value of results for guiding future interventions. The tasks of accurate measurement, interpretation, and attribution are essential to make use of results—for example, to replicate relevant features of an intervention. When such threats are recognized, they can be addressed in design or measurement innovations or simply by tempering interpretation of the study’s findings.
Threats to Construct Validity

Several threats described in this section can be conceptualized alternatively as measurement error, confounding, or a consistency violation. Consider the DAG in Figure Figure2A. 2 A. Suppose E is completing high school coursework, which affects health outcome D, E m is having a high school completion credential, and U is passing a general educational development (GED) test. The GED is a US high school credential but does not require the same coursework as a diploma.

Threats to construct validity represented as directed acyclic graphs.
If the investigator were interested in the effect of high school credentials on health, then low-construct validity could be conceptualized as a consistency violation. Consistency implies that any variations in conditions leading to the exposure assignment or implementation of the exposure would still result in the same observed outcome. 19 Attempts to replicate the study’s findings by intervening on GED tests would be unsuccessful because the resulting changes in credentials would not affect coursework or health.
Alternatively, this issue could be conceptualized as confounding of the E m –D association, where failure to control for coursework would bias the estimated credentials-health association. Finally, if the investigator were interested in the effect of coursework on health, but what they measured is the credentials-health association, the difference between the true effect and the measured effect could be attributed to measurement error.
Threats 19–21
Inadequate explication of constructs, construct confounding, and confounding constructs with levels of constructs all refer to situations where the named variable (typically the exposure) to which the relationship is attributed does not capture all aspects of the variables that are actually operating to generate the relationship. These threats can be conceptualized as measurement error, 13 confounding, or a violation of consistency (Figure (Figure2 2 A).
Continuing with the same example of high school credentials and health, construct confounding might occur if coursework co-varied too closely with credentials to be controlled separately. Failure to consider both coursework and passing a GED test as part of credentials would be inadequate explication of constructs. If conclusions drawn about the association then refer to levels beyond the range actually observed (e.g., extrapolation from a study of high school credentials to doctoral degrees), then the threat is confounding constructs with levels of constructs or alternatively, restriction of the range (eFigure 1C; http://links.lww.com/EDE/B634 and eFigure 1D; http://links.lww.com/EDE/B634 ).
Threats 22–23
Mono-operation bias and mono-method bias most commonly refer to nondifferential or differential measurement error 13 (Figure (Figure2, 2 , B and C, respectively), but they can also be conceptualized as confounding or consistency violations (Figure (Figure2A). 2 A). Concerns about measurement error with respect to construct validity relate to the fact that, unless it can be measured and accounted for, sources of measurement error must be considered as part of the variable to which the association is attributed. For example, exclusive reliance on self-reported exposure to community violence might inadvertently incorporate respondent outlook as part of the exposure (mono-operation bias). If the outcome (e.g., perceived wellbeing) is also self-reported, respondent outlook could also induce a spurious correlation (mono-method bias).
Treatment sensitive factorial structure: see eAppendix; http://links.lww.com/EDE/B634 .
Reactive self-report changes: see eAppendix; http://links.lww.com/EDE/B634 .
Threats 26–28
Compensatory equalization, compensatory rivalry, and resentful demoralization arise when participants or others respond to treatment assignment in unexpected ways. This is important in unmasked studies because the response may influence the outcome and any outcome differences between treated and untreated may partially reflect the compensatory responses (Figure (Figure2 2 D). 20 For causal questions about the effects of E on D using T as an instrumental variable (e.g., in an randomized controlled trial), this is a threat to the exclusion restriction, and T is no longer a valid instrument for the effect of E on D. This structure does not bias the intent-to-treat estimates of the effects of T; it leads to a serious misinterpretation, however, because a nonzero intent-to-treat estimate does not imply any effect of E on D. These threats might arise, for example, in a study of a weight loss program, where those assigned to the control condition pursue other weight loss services to compensate, or become extra motivated or demotivated to lose weight.
Threats 29–31
Reactivity to the experimental situation, experimenter expectancies, and novelty and disruption effects involve failure to consider a response to exposure as a component of the exposure (Figure (Figure2E). 2 E). Continuing the weight loss program example, researchers may assume any effects relate to a program feature such as dietary recommendations or physical activity regimen, whereas exposed participants’ outcomes may alternatively be affected by knowing they are participating in a weight loss program itself, by investigator’s expectations that they will lose weight, or by the novel experience of participating, being part of a weight loss program that interrupts their daily routines. Similar to reactive self-reports changes, this threat is particularly relevant when participants are not masked to exposure.
Failure to include the experimental situation or experimenter expectancies as part of the exposure construct can be considered a consistency violation. This results in a misinterpretation of results as indicating that the program is effective. It is especially problematic because expectancies will likely not be stable in future implementations of the intervention. Alternatively, a measured exposure that incorporates the experimental situation or experimenter expectancies could be considered measurement error in the exposure of interest (i.e., dietary restrictions or physical activity recommendations).
Treatment diffusion: see eAppendix; http://links.lww.com/EDE/B634 .
THREATS TO EXTERNAL VALIDITY
External validity concerns relate to the populations and places to which study results can be generalized, and the fact that the causal relationship of interest may interact with participant characteristics, settings, the types of outcomes measured, or treatment variations. Most often, threats to external validity (Table (Table4) 4 ) are addressed in the interpretation of results, in which the investigator must clearly delineate the target population to whom the results refer (e.g., with respect to sociodemographics or geography) and judge the extent to which the findings are relevant to individuals, treatments, outcomes, and settings beyond the ones studied. However, external validity concerns can also be addressed with design or analytic features such as oversampling of underrepresented groups or modeling causal interactions.
Threats to External Validity

Many threats to external validity relate to effect measure modification. 21 Effect measure modification is scale-dependent, so if the exposure and another variable both affect the outcome, it will occur on the additive scale (difference measures), the multiplicative scale (ratio measures), or both. Effect measure modification can therefore be represented on DAGs by including the modifying variable with an arrow pointing into the outcome.
Threats 33–34
Interaction of the causal relationship with units and interactions of the causal relationship with settings are both forms of effect measure modification that can arise when individual characteristics or contextual factors (respectively) affect the outcome (Figure (Figure3A) 3 A) or affect a mediator M of the E–D association (Figure (Figure3B). 3 B). Such effect measure modification threatens external validity when the distributions of these factors (U) differ between the study population and the population to which inference is being made. For example, in a study of the impact of neighborhood deprivation on risky sexual behavior, the measured effect may depend on the cultural background of the study participants or on other features of the contextual environment such as urban blight. Failure to measure and account for these modifiers when generalizing the study results to another population constitutes a threat to external validity.

Threats to external validity represented as directed acyclic graphs.
Context-dependent mediation: See eAppendix; http://links.lww.com/EDE/B634 .
Interaction of the causal relationship with outcomes refers to the fact that a cause-effect relationship may exist for one outcome (e.g., 5-year all-cause mortality) but not another seemingly related outcome (e.g., self-rated health). Whether we expect the established causal relation to extend to a new outcome depends on the causal structure linking the two outcomes. In some cases, multiple constructs may arise from a single latent variable or have a shared mechanism of action, thus the exposure would be expected to affect both outcomes (Figure (Figure3C). 3 C). In other cases, the outcomes are apparently unrelated, and we would not necessarily expect the same association with the exposure or confounding variables (Figure (Figure3 3 D).
Interaction of the causal relationship over treatment variations means that variations in the exposure do not result in the same observed outcome. If differences in the impacts of two distinct but related exposures are clearly defined, differences in their impacts are logical and perhaps expected. If, however, the exposure variations are intended to represent the same underlying variable, such a threat may constitute measurement error or a violation of consistency (Figure (Figure2 2 A). 22
DISCUSSION AND CONCLUSIONS
To our knowledge, this is the first comprehensive map of the correspondence between Shadish, Cook, and Campbell’s threats to validity with DAGs. Although the Campbell tradition and DAGs arise from distinct practices, there is no direct conflict between them. Both approaches will be helpful to applied researchers—the Campbell tradition’s to recognize “what can go wrong” in real studies and DAGs to represent these difficulties in a formal language that can immediately inform whether effects of interest are identifiable and lead to new insights on how to deal with threats. To the extent that the Campbell tradition reflects those challenges that most commonly threaten empirical research, 5 the DAGs presented here can be considered a base library for DAG development. This library may be particularly useful, given that causal inference training in DAGs does not typically emphasize how to represent common problems in applied studies as DAGs.
Most DAGs can be boiled down to confounding, collider stratification bias, or measurement error, but the more detailed stories cataloged by Shadish, Cook, and Campbell help researchers to comprehend and recognize specific challenges in study design, statistical analysis, measurement, generalization, and interpretation. DAGs can lend clarity to problems that can easily go undetected or cause persistent confusion when left un-graphed. 23 They can also help avoid intuitively appealing but erroneous methodological decisions. For example, explication of regression to the mean (threat 5) highlights why studies involving treatment of participants for their extreme baseline outcomes may be problematic. 23 An intuitive solution is then to include a contemporaneous untreated group and to adjust for differences in measured baseline outcomes. The corresponding DAG in Figure Figure1E 1 E clearly shows why controlling for measured baseline outcomes may mistakenly induce a spurious association. This example highlights how pairing assessment of threats to validity with DAGs can enhance researchers’ ability to identify and rule out alternative explanations for an association and to conduct valid studies.
We note several caveats of the present work: The 37 threats are not a collectively exhaustive list of all the ways studies can go wrong. Threats to validity are categorized into four buckets, but these categories are not ironclad; in fact, they have evolved with successive editions. 1 – 3 They simply provide a useful conceptual organization. Therefore, ruling out all named threats does not necessarily imply that the association can be interpreted causally. Additionally, we present simple DAGs corresponding to the various threats. In real applications, more complex causal structures are likely appropriate.
A primary goal of the epidemiologist’s work is to draw causal inferences about the relationships between exposures and outcomes. Tools from other disciplines can enhance the work of epidemiologists, not only by informing causal diagrams. Efforts to map causal inference concepts across disciplines are growing 24 , 25 and offer researchers the opportunity to collaborate more effectively and to understand and leverage a broader range of tools and concepts useful when addressing causal research questions.
Supplementary Material
Supported by Evidence for Action program of the Robert Wood Johnson Foundation.
The authors report no conflicts of interest.
Supplemental digital content is available through direct URL citations in the HTML and PDF versions of this article ( www.epidem.com ).
COMMENTS
That said, if you use the term statistical conclusion validity, that's usually taken as meaning there's some type of statistical data analysis involves (i.e. that your research has quantitative data). It's important to realize that there's no such thing as perfect validity. Type 1 errors and Type 2 errors are a part of any testing ...
To achieve statistical validity, it is essential for researchers to have sufficient data and also choose the right statistical approach to analyze that data. Furthermore, statistical validity also refers to whether statistics derived from a research study are in agreement with its scientific laws. Thus, if a given data set draws a conclusion ...
The fourth aspect of research validity, which Cook and Campbell called statistical conclusion validity (SCV), is the subject of this paper. Cook and Campbell, 1979 , pp. 39-50) discussed that SCV pertains to the extent to which data from a research study can reasonably be regarded as revealing a link (or lack thereof) between independent and ...
Statistical conclusions are claims made based on the strength of statistical results. When thinking about the validity of statistical conclusions, we are applying the principles of relativism described in Chapter 1. The goal is to falsify the null hypothesis or test competing explanations for phenomena. Threats to the validity of statistical ...
Statistical conclusion validity is the degree to which conclusions about the relationship among variables based on the data are correct or "reasonable". This began as being solely about whether the statistical conclusion about the relationship of the variables was correct, but now there is a movement towards moving to "reasonable" conclusions that use: quantitative, statistical, and ...
Conclusion validity is the degree to which the conclusion we reach is credible or believable. Although conclusion validity was originally thought to be a statistical inference issue, it has become more apparent that it is also relevant in qualitative research. For example, in an observational field study of homeless adolescents the researcher ...
Table 6.1 Validity questions in analysis, interpretation, and conclusion. Full size table. Generally, the validity at this stage has to do with coherence or consistence in the story that an evaluation is trying to tell (Peck et al., 2012 ). The consistency of an evaluation's story definitely affects the persuasiveness of its argument.
38) define statistical conclusion validity as the "validity of inferences about the correlation (covariance) between treatment and outcome.". In principle, all nine of the common threats to statistical conclusion validity identified by Shadish et al. (Table 6.1) apply to time series designs.
The ultimate goal of research is to produce dependable knowledge or to provide the evidence that may guide practical decisions. Statistical conclusion validity (SCV) holds when the conclusions of a research study are founded on an adequate analysis of the data, generally meaning that adequate statistical methods are used whose small-sample behavior is accurate, besides being logically capable ...
Statistical conclusion validity is an issue whenever statistical tests are used to test hypotheses. The research design can address threats to validity through. considerations of statistical power. alpha reduction procedures (e.g., Bonferoni technique) when multiple tests are used. use of reliable instruments.
Statistical conclusion validity is concerned with an integrated evaluation of statistical power, significance testing, and effect size. ... Statistical Research Memoirs, 2, 126-149. Google Scholar. Tatsuoka, M. M. (1988). Multivariate analysis: Techniques for educational and psychological research. New York: Macmillan.
Statistical conclusion validity (SCV) holds when the conclusions of a research study are founded on an adequate analysis of the data, generally meaning that adequate statistical methods are used whose small-sample behavior is accurate, besides being logically capable of providing an answer to the research question. Compared to the three other ...
Research validity refers to the degree to which a study accurately measures or reflects what it claims to measure. In other words, research validity concerns whether the conclusions drawn from a study are based on accurate, reliable and relevant data. ... Statistical Conclusion Validity: Limitations in statistical conclusion validity can occur ...
There are different kinds of statistical validities that are relevant to research and experimentation. Each of these is important in order for the experiment to give accurate predictions and draw valid conclusions. Some of these are: Construct Validity: Construct validity is a type of statistical validity that ensures that the actual experimentation and data collection conforms to the theory ...
Statistical conclusion validity (SCV) holds when the conclusions of a research study are founded on an adequate analysis of the data, gen-erally meaning that adequate statistical methods are used ...
Statistical Conclusion Validity. Shadish et al. define statistical conclusion validity as the validity of the conclusion that the dependent variable covaries with the independent variable, as well as that of any conclusions regarding the degree of their covariation. In other words, it concerns the question of whether an effect was observed in ...
Step 10. Evaluate threats to statistical conclusion validity. Shadish et al 9 provide nine threats to statistical conclusion validity in drawing inferences about the relationship between two variables; the threats can broadly apply to many statistical analyses. Although it helps to consider and anticipate these threats when designing a research ...
The quality of research designs can be defined in terms of four key design attributes: internal validity, external validity, construct validity, and statistical conclusion validity. Internal validity, also called causality, examines whether the observed change in a dependent variable is indeed caused by a corresponding change in hypothesized ...
Statistical conclusions validity refers to the degree to which we make correct statistical inferences from the analysis of data. ... Probability and How Type 1 and Type 2 Errors Obscure the Interpretation of Findings in Communication Research Literatures. Timothy R. Levine Department of Communication , Michigan State University Correspondence ...
The fourth aspect of research validity, which Cook and Campbell called statistical conclusion validity (SCV), is the subject of this paper. Cook and Campbell, 1979 , pp. 39-50) discussed that SCV pertains to the extent to which data from a research study can reasonably be regarded as revealing a link (or lack thereof) between independent and ...
Statistical conclusion validity (SCV) holds when the conclusions of a research study are founded on an adequate analysis of the data, generally meaning that adequate statistical methods are used ...
In the pursuit of scientific knowledge, statistical conclusion validity plays a pivotal role in ensuring that your research findings are robust and valid. By addressing threats to validity and employing sound strategies, you can enhance the accuracy of your conclusions. This, in turn, contributes to the cumulative progress of science and the ...
Threats are organized into issues of statistical conclusion validity, internal validity, construct validity, or external validity. To assist epidemiologists in drawing the correct DAG for their application, we map the correspondence between threats to validity and epidemiologic concepts that can be represented with DAGs.